Estimated Value: $629,000 - $716,000
6
Beds
3
Baths
2,160
Sq Ft
$311/Sq Ft
Est. Value
About This Home
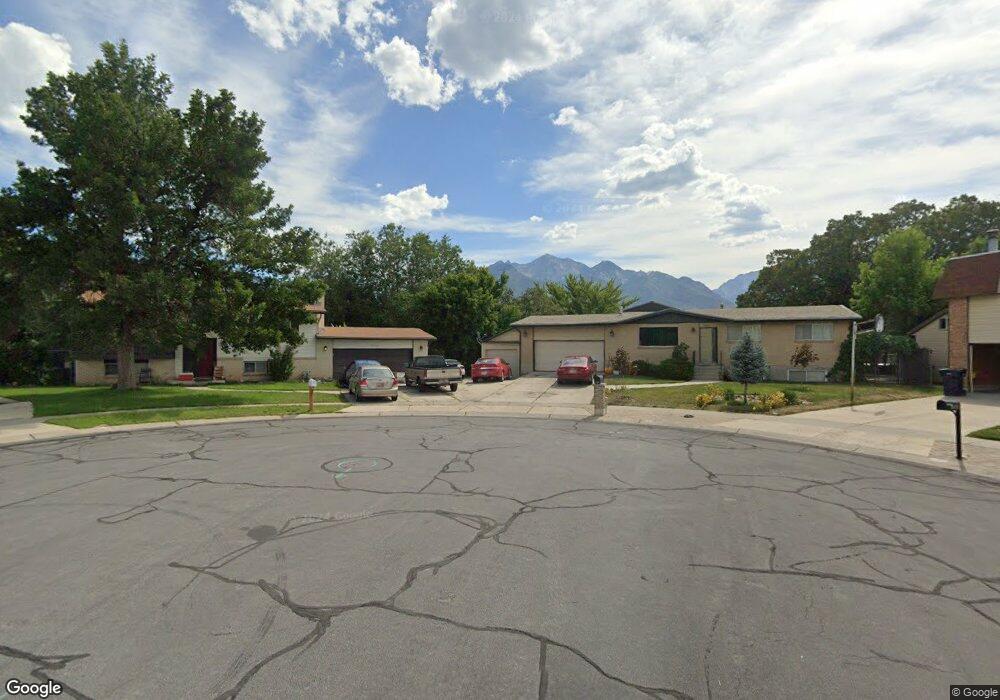
This home is located at 1564 E Boysenberry Cir, Sandy, UT 84093 and is currently estimated at $671,817, approximately $311 per square foot. 1564 E Boysenberry Cir is a home located in Salt Lake County with nearby schools including Peruvian Park Elementary School, Hillcrest High School, and Union Middle School.
Ownership History
Date
Name
Owned For
Owner Type
Purchase Details
Closed on
Jun 9, 2017
Sold by
Eresuma Family Lp
Bought by
Eresuma Family Llc
Current Estimated Value
Purchase Details
Closed on
Nov 23, 2015
Sold by
Marler Anthony
Bought by
Eresuma Family Lp
Purchase Details
Closed on
Sep 28, 2015
Sold by
Mccarter Garrett and Mccarter Wendy Jill
Bought by
Marler Anthony
Purchase Details
Closed on
Feb 7, 2001
Sold by
Mccarter Garrett
Bought by
Mccarter Garrett and Mccarter Wendy Jill
Home Financials for this Owner
Home Financials are based on the most recent Mortgage that was taken out on this home.
Original Mortgage
$55,000
Interest Rate
7.12%
Mortgage Type
Stand Alone Second
Purchase Details
Closed on
Jan 8, 1999
Sold by
Butt David L and Butt Elaine
Bought by
Mccarter Garrett
Home Financials for this Owner
Home Financials are based on the most recent Mortgage that was taken out on this home.
Original Mortgage
$145,400
Interest Rate
6.73%
Create a Home Valuation Report for This Property
The Home Valuation Report is an in-depth analysis detailing your home's value as well as a comparison with similar homes in the area
Home Values in the Area
Average Home Value in this Area
Purchase History
| Date | Buyer | Sale Price | Title Company |
|---|---|---|---|
| Eresuma Family Llc | -- | None Available | |
| Eresuma Family Lp | -- | Founders Title Company | |
| Marler Anthony | -- | Founders Title Layton | |
| Mccarter Garrett | -- | Transcontinental Title | |
| Mccarter Garrett | -- | Superior Title Company |
Source: Public Records
Mortgage History
| Date | Status | Borrower | Loan Amount |
|---|---|---|---|
| Previous Owner | Mccarter Garrett | $55,000 | |
| Previous Owner | Mccarter Garrett | $145,400 |
Source: Public Records
Tax History
| Year | Tax Paid | Tax Assessment Tax Assessment Total Assessment is a certain percentage of the fair market value that is determined by local assessors to be the total taxable value of land and additions on the property. | Land | Improvement |
|---|---|---|---|---|
| 2025 | $2,662 | $647,800 | $177,400 | $470,400 |
| 2024 | $2,662 | $498,900 | $164,200 | $334,700 |
| 2023 | $2,599 | $486,300 | $156,100 | $330,200 |
| 2022 | $2,687 | $494,500 | $153,000 | $341,500 |
| 2021 | $2,319 | $363,400 | $137,700 | $225,700 |
| 2020 | $2,184 | $323,000 | $126,000 | $197,000 |
| 2019 | $1,886 | $272,100 | $118,800 | $153,300 |
| 2018 | $1,769 | $266,900 | $118,800 | $148,100 |
| 2017 | $1,772 | $255,700 | $118,800 | $136,900 |
| 2016 | $1,732 | $241,700 | $118,800 | $122,900 |
| 2015 | $1,814 | $234,700 | $123,600 | $111,100 |
| 2014 | $1,810 | $225,400 | $120,000 | $105,400 |
Source: Public Records
Map
Nearby Homes
- 1627 E Mulberry Way
- 8081 Beaumont Dr
- 8411 S 1475 E
- 8352 S 1330 E
- 8492 S Mesa Dr
- 1341 E Creek Rd
- 1371 Sudbury Ave
- 8638 Piper Ln
- 8642 S Cessna Cir
- 8492 Fayeway Dr
- 1430 E 8685 S
- 1579 E 8730 S
- 8373 S 1100 E Unit 39
- 7755 S 1130 E
- 8569 Round Stone Cove
- 8569 Round Stone Cove Unit 8
- 1990 E Terra Vista Way
- 1924 E Viscounti Cove
- 8483 Terrace Dr
- 8797 S Capella Way
- 1564 Boysenberry Cir
- 1554 Boysenberry Cir
- 1569 Boysenberry Cir
- 1561 Blueberry Hill
- 1554 E Boysenberry Cir
- 8136 Miranda Ln
- 8136 S Miranda Ln
- 8150 Miranda Ln
- 8160 Miranda Ln
- 1551 E Blueberry Hill
- 1551 Blueberry Hill
- 1544 Boysenberry Cir
- 1553 E Boysenberry Cir
- 1553 Boysenberry Cir
- 1541 Blueberry Hill
- 8172 Miranda Ln
- 8126 Miranda Ln
- 8126 S Miranda Ln
- 1543 Boysenberry Cir
- 1571 Blueberry Hill
Your Personal Tour Guide
Ask me questions while you tour the home.