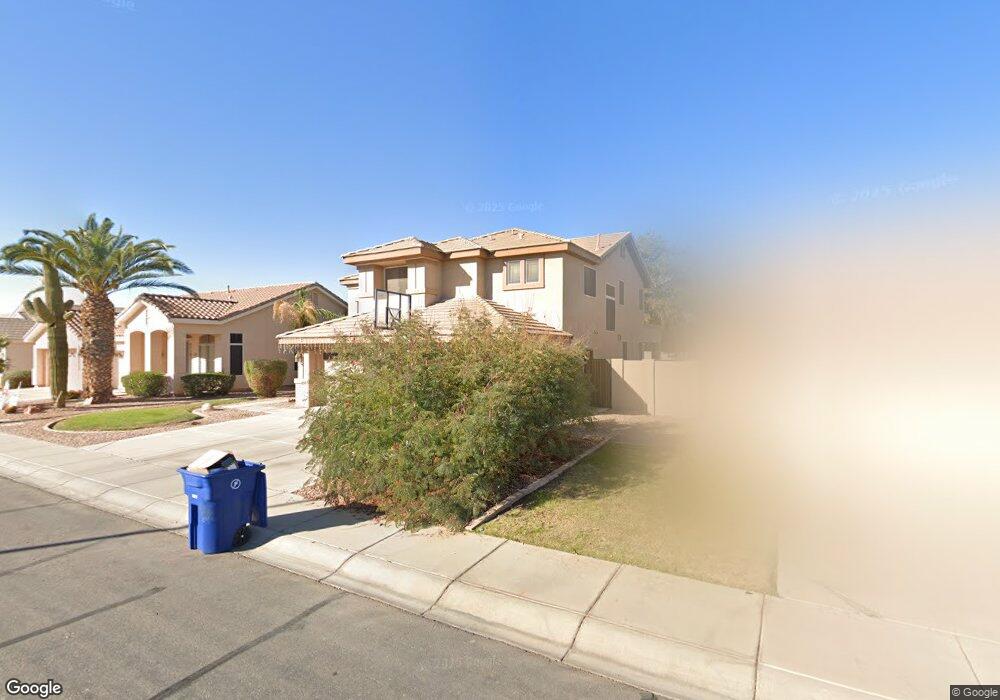
1564 E Harrison St Chandler, AZ 85225
East Chandler NeighborhoodEstimated Value: $647,769 - $711,000
4
Beds
3
Baths
2,510
Sq Ft
$273/Sq Ft
Est. Value
About This Home
This home is located at 1564 E Harrison St, Chandler, AZ 85225 and is currently estimated at $685,942, approximately $273 per square foot. 1564 E Harrison St is a home located in Maricopa County with nearby schools including Sanborn Elementary School, Willis Junior High School, and Chandler High School.
Ownership History
Date
Name
Owned For
Owner Type
Purchase Details
Closed on
Dec 7, 2011
Sold by
Minetto Daniel E and Minetto Michele L
Bought by
Mcconnell Rachel
Current Estimated Value
Home Financials for this Owner
Home Financials are based on the most recent Mortgage that was taken out on this home.
Original Mortgage
$243,564
Outstanding Balance
$165,490
Interest Rate
3.87%
Mortgage Type
FHA
Estimated Equity
$520,452
Purchase Details
Closed on
Dec 23, 2004
Sold by
Minetto Daniel E and Minetto Michele L
Bought by
Minetto Daniel E and Minetto Michele L
Purchase Details
Closed on
Nov 26, 1997
Sold by
Fulton Homes Sales Corp
Bought by
Minetto Daniel E and Minetto Michele L
Home Financials for this Owner
Home Financials are based on the most recent Mortgage that was taken out on this home.
Original Mortgage
$151,252
Interest Rate
7.31%
Mortgage Type
New Conventional
Create a Home Valuation Report for This Property
The Home Valuation Report is an in-depth analysis detailing your home's value as well as a comparison with similar homes in the area
Home Values in the Area
Average Home Value in this Area
Purchase History
| Date | Buyer | Sale Price | Title Company |
|---|---|---|---|
| Mcconnell Rachel | $249,900 | Security Title Agency | |
| Minetto Daniel E | -- | -- | |
| Minetto Daniel E | $175,252 | Security Title Agency | |
| Fulton Homes Sales Corp | $111,258 | Security Title Agency |
Source: Public Records
Mortgage History
| Date | Status | Borrower | Loan Amount |
|---|---|---|---|
| Open | Mcconnell Rachel | $243,564 | |
| Previous Owner | Minetto Daniel E | $151,252 |
Source: Public Records
Tax History
| Year | Tax Paid | Tax Assessment Tax Assessment Total Assessment is a certain percentage of the fair market value that is determined by local assessors to be the total taxable value of land and additions on the property. | Land | Improvement |
|---|---|---|---|---|
| 2025 | $2,509 | $32,209 | -- | -- |
| 2024 | $2,423 | $30,675 | -- | -- |
| 2023 | $2,423 | $46,330 | $9,260 | $37,070 |
| 2022 | $2,338 | $35,750 | $7,150 | $28,600 |
| 2021 | $2,451 | $34,200 | $6,840 | $27,360 |
| 2020 | $2,440 | $31,980 | $6,390 | $25,590 |
| 2019 | $2,346 | $29,970 | $5,990 | $23,980 |
| 2018 | $2,272 | $28,350 | $5,670 | $22,680 |
| 2017 | $2,118 | $27,010 | $5,400 | $21,610 |
| 2016 | $2,040 | $26,050 | $5,210 | $20,840 |
| 2015 | $1,977 | $25,810 | $5,160 | $20,650 |
Source: Public Records
Map
Nearby Homes
- 1402 E Shannon St
- 1594 E Megan St
- 1691 E Gary Dr
- 741 N Soho Place
- 1030 N Mason Dr
- 1779 E Oakland St
- 1146 E Dublin St
- 1650 E Countrywalk Ln
- 414 N Hudson Place
- 1940 E Oakland St
- 1070 E Oakland St
- 1126 N Melody Cir
- 510 N Jesse Ct
- 982 E Carla Vista Place
- 2085 E Hulet Place
- 1951 E Baylor Ct
- 238 N Hudson Place
- 1605 E Chandler Blvd Unit 26
- 1680 E Sheffield Ave
- 1449 E Kent Ave
- 1578 E Harrison St
- 1550 E Harrison St
- 1549 E Robinson Way
- 1536 E Harrison St
- 1577 E Robinson Way
- 1535 E Robinson Way
- 1565 E Harrison St
- 1551 E Harrison St
- 1583 E Robinson Way
- 1579 E Harrison St
- 1537 E Harrison St
- 1592 E Harrison St
- 1522 E Harrison St
- 1521 E Robinson Way
- 1521 E Robinson Way Unit 800
- 1585 E Harrison St
- 1523 E Harrison St
- 1591 E Robinson Way
- 1606 E Harrison St
- 1508 E Harrison St