Estimated Value: $394,000 - $420,856
3
Beds
3
Baths
1,511
Sq Ft
$269/Sq Ft
Est. Value
About This Home
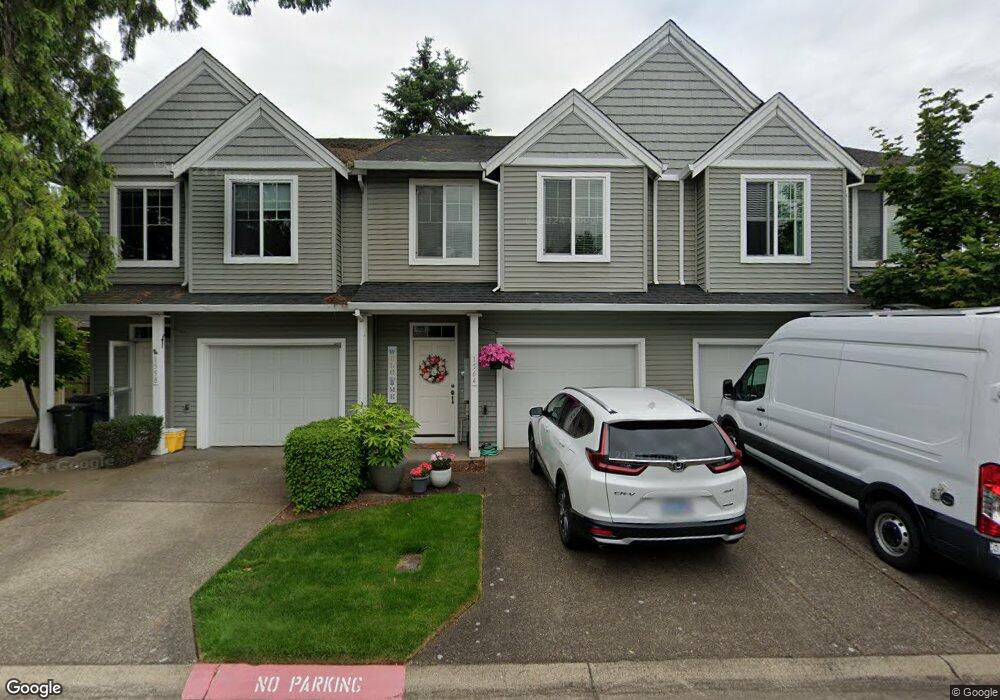
This home is located at 1564 NE 10th Place, Canby, OR 97013 and is currently estimated at $405,714, approximately $268 per square foot. 1564 NE 10th Place is a home located in Clackamas County with nearby schools including Josefa L. Sambrano Elementary School, William Knight Elementary School, and Baker Prairie Middle School.
Ownership History
Date
Name
Owned For
Owner Type
Purchase Details
Closed on
Oct 16, 2014
Sold by
Vasquez Frank and Vasquez Rodrigo J
Bought by
Alvarado Monica
Current Estimated Value
Home Financials for this Owner
Home Financials are based on the most recent Mortgage that was taken out on this home.
Original Mortgage
$164,957
Outstanding Balance
$127,350
Interest Rate
4.37%
Mortgage Type
FHA
Estimated Equity
$278,364
Purchase Details
Closed on
Jan 22, 2010
Sold by
Wohlers Mark R and Wohlers Kristen M
Bought by
Vasquez Frank and Vasquez Rodrigo J
Home Financials for this Owner
Home Financials are based on the most recent Mortgage that was taken out on this home.
Original Mortgage
$180,667
Interest Rate
5.5%
Mortgage Type
FHA
Purchase Details
Closed on
Apr 2, 2004
Sold by
Garden Crossing Llc
Bought by
Wohlers Mark R and Wohlers Kristen M
Home Financials for this Owner
Home Financials are based on the most recent Mortgage that was taken out on this home.
Original Mortgage
$150,272
Interest Rate
5.87%
Mortgage Type
New Conventional
Create a Home Valuation Report for This Property
The Home Valuation Report is an in-depth analysis detailing your home's value as well as a comparison with similar homes in the area
Home Values in the Area
Average Home Value in this Area
Purchase History
| Date | Buyer | Sale Price | Title Company |
|---|---|---|---|
| Alvarado Monica | $168,000 | Wfg Title | |
| Vasquez Frank | $184,000 | Stewart Title | |
| Wohlers Mark R | $187,840 | Chicago Title Insurance Co |
Source: Public Records
Mortgage History
| Date | Status | Borrower | Loan Amount |
|---|---|---|---|
| Open | Alvarado Monica | $164,957 | |
| Previous Owner | Vasquez Frank | $180,667 | |
| Previous Owner | Wohlers Mark R | $150,272 | |
| Closed | Wohlers Mark R | $37,568 |
Source: Public Records
Tax History Compared to Growth
Tax History
| Year | Tax Paid | Tax Assessment Tax Assessment Total Assessment is a certain percentage of the fair market value that is determined by local assessors to be the total taxable value of land and additions on the property. | Land | Improvement |
|---|---|---|---|---|
| 2025 | $4,182 | $236,040 | -- | -- |
| 2024 | $4,065 | $229,166 | -- | -- |
| 2023 | $4,065 | $222,492 | $0 | $0 |
| 2022 | $3,739 | $216,012 | $0 | $0 |
| 2021 | $3,600 | $209,721 | $0 | $0 |
| 2020 | $3,536 | $203,613 | $0 | $0 |
| 2019 | $3,367 | $197,683 | $0 | $0 |
| 2018 | $3,292 | $191,925 | $0 | $0 |
| 2017 | $3,208 | $186,335 | $0 | $0 |
| 2016 | $3,101 | $180,908 | $0 | $0 |
| 2015 | $2,995 | $175,639 | $0 | $0 |
| 2014 | $3,529 | $170,523 | $0 | $0 |
Source: Public Records
Map
Nearby Homes
- 1558 NE 10th Place
- 1346 NE 16th Ave
- 1620 N Sweetgum St
- 860 NE 14th Ave
- 1422 NE 18th Place
- 1009 NE 17th Ave
- 947 NE 17th Ave
- 1552 NE 19th Loop
- 878 NE 17th Ave
- 952 NE 17th Ave
- 1750 N Oak St
- 853 NE 17th Ave
- 835 SE 1st Ave Unit 64
- 835 SE 1st Ave Unit 14
- 835 SE 1st Ave Unit 12
- 835 SE 1st Ave Unit 17
- 844 NE 17th Ave
- 832 NE 17th Ave
- 1111 SE 3rd Ave Unit 74
- 1200 NE Territorial Rd Unit 93
- 1572 NE 10th Place
- 996 N Redwood St
- 1525 NE 11th Ave
- 1505 NE 11th Ave
- 1540 NE 10th Place
- 1567 NE 10th Place
- 1559 NE 10th Place
- 1575 NE 10th Place
- 1553 NE 10th Place
- 1104 NE Spruce Ct
- 1547 NE 10th Place
- 1589 NE 10th Place
- 1112 NE Spruce Ct
- 1535 NE 10th Place
- 1597 NE 10th Place
- 1115 NE Spruce Ct
- 1115 N Spruce Ct
- 1605 NE 10th Place
- 1118 N Spruce Ct
- 1118 NE Spruce Ct