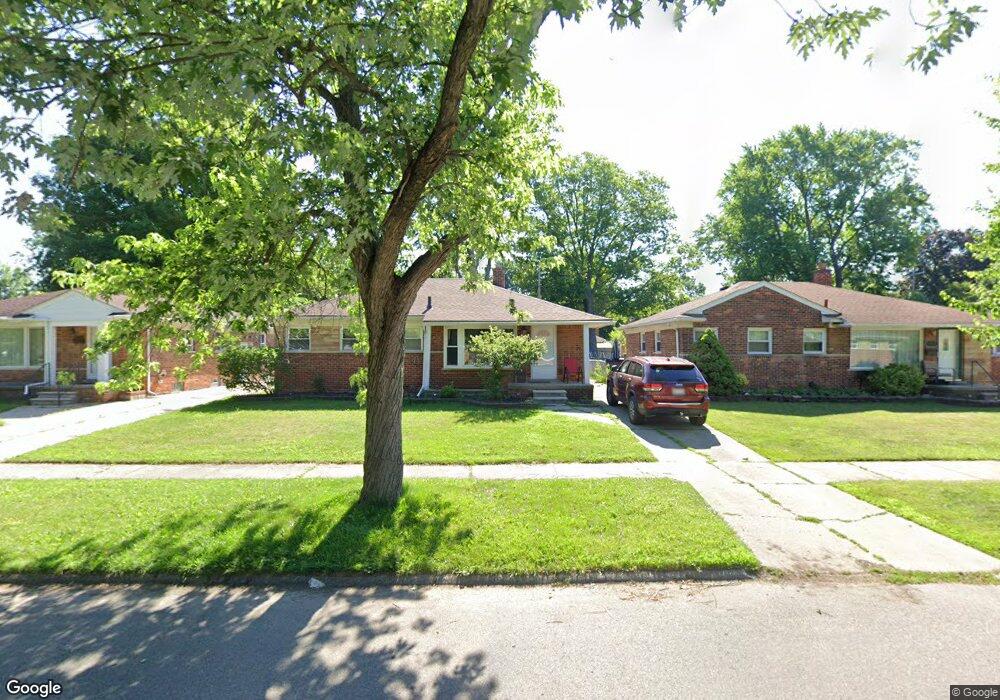
15644 Denby Unit Bldg-Unit Redford, MI 48239
Estimated Value: $202,000 - $224,000
--
Bed
2
Baths
1,064
Sq Ft
$200/Sq Ft
Est. Value
About This Home
This home is located at 15644 Denby Unit Bldg-Unit, Redford, MI 48239 and is currently estimated at $212,451, approximately $199 per square foot. 15644 Denby Unit Bldg-Unit is a home located in Wayne County with nearby schools including Beech Elementary School, Hilbert Elementary School, and American Montessori Academy.
Ownership History
Date
Name
Owned For
Owner Type
Purchase Details
Closed on
Jun 18, 2018
Sold by
Booth Angela C and Booth Bryson G
Bought by
Henry Teresa
Current Estimated Value
Purchase Details
Closed on
Jul 26, 2012
Sold by
Ray James F and Ray Staci A
Bought by
Federal Home Loan Mortgage Corporation
Purchase Details
Closed on
Mar 30, 2007
Sold by
Ray James F and Ray Staci A
Bought by
Ray James F
Home Financials for this Owner
Home Financials are based on the most recent Mortgage that was taken out on this home.
Original Mortgage
$135,000
Interest Rate
6.2%
Mortgage Type
New Conventional
Purchase Details
Closed on
Mar 23, 1998
Sold by
Muliett Michelle M
Bought by
Muliett Dennis
Purchase Details
Closed on
Nov 7, 1995
Sold by
Dennis V and Dennis Michelle M
Bought by
Dennis V and Muliett Michelle M
Create a Home Valuation Report for This Property
The Home Valuation Report is an in-depth analysis detailing your home's value as well as a comparison with similar homes in the area
Home Values in the Area
Average Home Value in this Area
Purchase History
| Date | Buyer | Sale Price | Title Company |
|---|---|---|---|
| Henry Teresa | $127,000 | Title One Inc | |
| Federal Home Loan Mortgage Corporation | $135,114 | None Available | |
| Ray James F | -- | Blue Sky Title | |
| Muliett Dennis | $108,500 | -- | |
| Dennis V | $88,450 | -- |
Source: Public Records
Mortgage History
| Date | Status | Borrower | Loan Amount |
|---|---|---|---|
| Previous Owner | Ray James F | $135,000 |
Source: Public Records
Tax History Compared to Growth
Tax History
| Year | Tax Paid | Tax Assessment Tax Assessment Total Assessment is a certain percentage of the fair market value that is determined by local assessors to be the total taxable value of land and additions on the property. | Land | Improvement |
|---|---|---|---|---|
| 2025 | $1,448 | $94,400 | $0 | $0 |
| 2024 | $1,448 | $87,700 | $0 | $0 |
| 2023 | $1,381 | $76,600 | $0 | $0 |
| 2022 | $3,290 | $68,800 | $0 | $0 |
| 2021 | $3,199 | $64,500 | $0 | $0 |
| 2020 | $3,154 | $54,100 | $0 | $0 |
| 2019 | $3,083 | $47,300 | $0 | $0 |
| 2018 | $752 | $40,500 | $0 | $0 |
| 2017 | $1,942 | $37,400 | $0 | $0 |
| 2016 | $2,200 | $33,500 | $0 | $0 |
| 2015 | $2,703 | $31,400 | $0 | $0 |
| 2013 | $2,560 | $26,100 | $0 | $0 |
| 2012 | $1,806 | $29,900 | $8,000 | $21,900 |
Source: Public Records
Map
Nearby Homes
- 15660 Meadowbrook Rd
- 15988 Delaware Ave
- 27416 Sunnydale St
- 27480 5 Mile Rd
- 15681 Foch St
- 15433 Norborne
- 14844 Inkster Rd
- 27510 Five Mile Rd
- 15389 Centralia
- 14920 Taylor Blvd
- 15802 Beech Daly Rd
- 15910 Beech Daly Rd
- 14907 Taylor Blvd
- 16632 Norborne
- 15741 Pomona Dr
- 27030 W 6 Mile Rd
- 26610 W 6 Mile Rd
- 17052 Kinloch
- 14328 Brook Dr
- 27674 Western Golf Dr