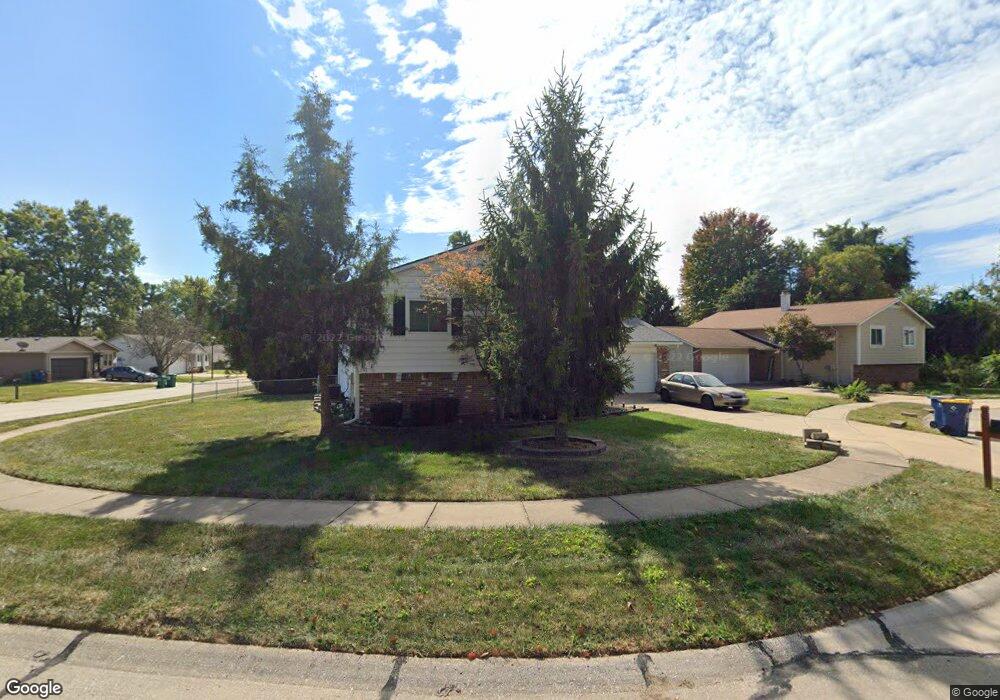
15649 93rd Ave Florissant, MO 63034
Estimated Value: $220,000 - $282,000
3
Beds
3
Baths
1,225
Sq Ft
$195/Sq Ft
Est. Value
About This Home
This home is located at 15649 93rd Ave, Florissant, MO 63034 and is currently estimated at $239,335, approximately $195 per square foot. 15649 93rd Ave is a home located in St. Louis County with nearby schools including Barrington Elementary School, North Middle School, and Hazelwood Central High School.
Ownership History
Date
Name
Owned For
Owner Type
Purchase Details
Closed on
Jul 16, 2024
Sold by
Parks Patrice
Bought by
Th Property Owner I Llc
Current Estimated Value
Purchase Details
Closed on
Jan 26, 2012
Sold by
Henke Judith H
Bought by
Yates Patrice
Home Financials for this Owner
Home Financials are based on the most recent Mortgage that was taken out on this home.
Original Mortgage
$108,146
Interest Rate
4%
Mortgage Type
New Conventional
Purchase Details
Closed on
Apr 12, 2011
Sold by
Household Finance Corporation Iii
Bought by
Henke Judith H
Purchase Details
Closed on
Oct 15, 2010
Sold by
Trach Richard S and Trach Jeanette E
Bought by
Household Finance Corporation Iii
Purchase Details
Closed on
Jul 29, 1998
Sold by
Mathis Glenn M and Mathis Holly C
Bought by
Trach Richard S and Trach Jeannette E
Home Financials for this Owner
Home Financials are based on the most recent Mortgage that was taken out on this home.
Original Mortgage
$92,718
Interest Rate
6.94%
Mortgage Type
VA
Create a Home Valuation Report for This Property
The Home Valuation Report is an in-depth analysis detailing your home's value as well as a comparison with similar homes in the area
Home Values in the Area
Average Home Value in this Area
Purchase History
| Date | Buyer | Sale Price | Title Company |
|---|---|---|---|
| Th Property Owner I Llc | -- | None Listed On Document | |
| Yates Patrice | $115,000 | Us Title Main | |
| Henke Judith H | $56,250 | None Available | |
| Household Finance Corporation Iii | $178,900 | None Available | |
| Trach Richard S | -- | -- |
Source: Public Records
Mortgage History
| Date | Status | Borrower | Loan Amount |
|---|---|---|---|
| Previous Owner | Yates Patrice | $108,146 | |
| Previous Owner | Trach Richard S | $92,718 |
Source: Public Records
Tax History Compared to Growth
Tax History
| Year | Tax Paid | Tax Assessment Tax Assessment Total Assessment is a certain percentage of the fair market value that is determined by local assessors to be the total taxable value of land and additions on the property. | Land | Improvement |
|---|---|---|---|---|
| 2025 | $3,217 | $39,860 | $5,260 | $34,600 |
| 2024 | $3,217 | $35,630 | $4,580 | $31,050 |
| 2023 | $3,217 | $35,630 | $4,580 | $31,050 |
| 2022 | $2,859 | $28,250 | $7,010 | $21,240 |
| 2021 | $2,705 | $28,250 | $7,010 | $21,240 |
| 2020 | $2,519 | $24,490 | $5,260 | $19,230 |
| 2019 | $2,499 | $24,490 | $5,260 | $19,230 |
| 2018 | $2,095 | $18,940 | $3,340 | $15,600 |
| 2017 | $2,092 | $18,940 | $3,340 | $15,600 |
| 2016 | $2,127 | $18,940 | $3,340 | $15,600 |
| 2015 | $2,046 | $18,940 | $3,340 | $15,600 |
| 2014 | $2,223 | $20,510 | $4,450 | $16,060 |
Source: Public Records
Map
Nearby Homes
- 4120 90th Ave
- 623 Bugle Run Dr
- 3811 Halter Ct
- 14736 Verdun Estates Dr
- 3914 Birkemeier Dr
- 15684 Birkemeier Dr
- 738 Waterfall Dr
- 4242 Vaile Ave
- 4097 Fox Island Dr
- 15467 Jost Main St
- 15509 Debridge Way
- 4368 Keevenshore Dr
- 3870 Hope Haven Dr
- 1025 Exacta Ct
- 3929 Hirondelle Ln
- 3898 Hirondelle Ln
- 989 Brookfield Chase Ct
- 15561 Debridge Way
- 644 Shadow Rock Dr
- 14663 Rouvre Dr
- 15675 93rd Ave
- 15643 93rd Ave
- 15650 93rd Ave
- 15656 93rd Ave
- 15637 93rd Ave
- 15668 93rd Ave
- 15644 93rd Ave
- 15681 93rd Ave
- 15674 93rd Ave
- 15662 93rd Ave
- 15584 Fox Plains Dr
- 15588 Fox Plains Dr
- 15686 Ninety-Third Ave
- 15638 93rd Ave
- 15680 93rd Ave
- 15592 Fox Plains Dr
- 15621 93rd Ave
- 15655 91st Ave
- 15632 93rd Ave
- 15643 91st Ave