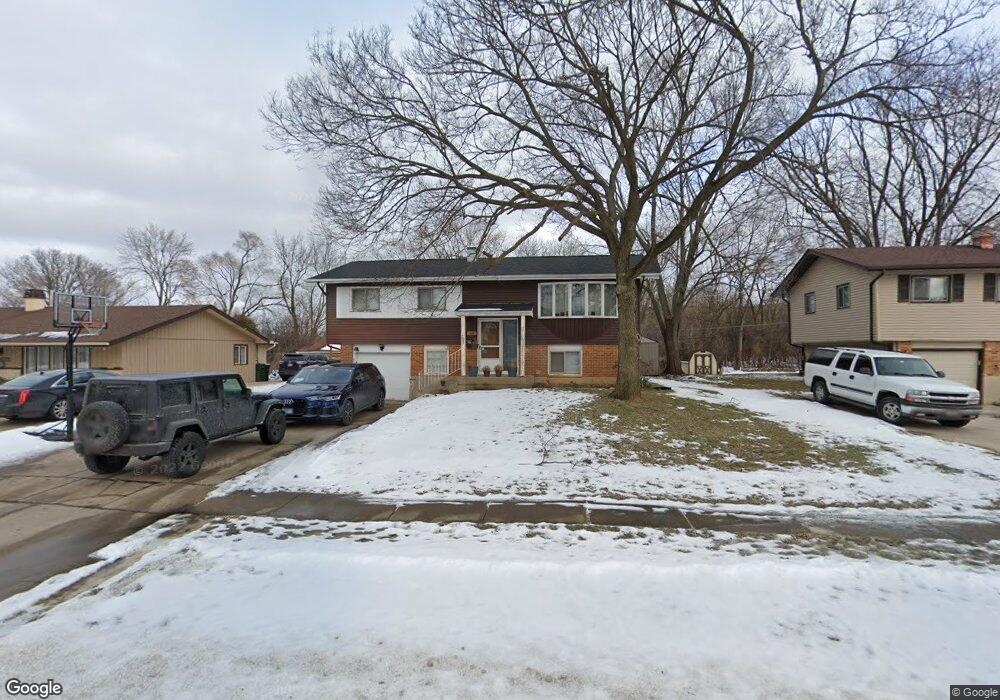
1565 Jefferson Rd Hoffman Estates, IL 60169
Highlands-Schaumburg NeighborhoodEstimated Value: $393,200 - $421,000
4
Beds
2
Baths
1,372
Sq Ft
$295/Sq Ft
Est. Value
About This Home
This home is located at 1565 Jefferson Rd, Hoffman Estates, IL 60169 and is currently estimated at $404,300, approximately $294 per square foot. 1565 Jefferson Rd is a home located in Cook County with nearby schools including Churchill Elementary School, Dwight D Eisenhower Junior High School, and Hoffman Estates High School.
Ownership History
Date
Name
Owned For
Owner Type
Purchase Details
Closed on
Jul 2, 2007
Sold by
Mak David and Mak Rowena
Bought by
Emberton David A and Emberton Jennifer S
Current Estimated Value
Home Financials for this Owner
Home Financials are based on the most recent Mortgage that was taken out on this home.
Original Mortgage
$279,125
Outstanding Balance
$173,732
Interest Rate
6.42%
Mortgage Type
FHA
Estimated Equity
$230,568
Purchase Details
Closed on
Feb 13, 2004
Sold by
Mak David and Namoca Rowena
Bought by
Mak David and Mak Rowena
Home Financials for this Owner
Home Financials are based on the most recent Mortgage that was taken out on this home.
Original Mortgage
$198,000
Interest Rate
5.74%
Mortgage Type
New Conventional
Purchase Details
Closed on
Jul 27, 2001
Sold by
Borta James R and Borta Patricia
Bought by
Mak David and Namoca Rowena
Home Financials for this Owner
Home Financials are based on the most recent Mortgage that was taken out on this home.
Original Mortgage
$205,000
Interest Rate
7.14%
Create a Home Valuation Report for This Property
The Home Valuation Report is an in-depth analysis detailing your home's value as well as a comparison with similar homes in the area
Home Values in the Area
Average Home Value in this Area
Purchase History
| Date | Buyer | Sale Price | Title Company |
|---|---|---|---|
| Emberton David A | $284,500 | Chicago Title Insurance Co | |
| Mak David | -- | Chicago Title Insurance Comp | |
| Mak David | $217,000 | Chicago Title Insurance Co |
Source: Public Records
Mortgage History
| Date | Status | Borrower | Loan Amount |
|---|---|---|---|
| Open | Emberton David A | $279,125 | |
| Previous Owner | Mak David | $198,000 | |
| Previous Owner | Mak David | $205,000 |
Source: Public Records
Tax History Compared to Growth
Tax History
| Year | Tax Paid | Tax Assessment Tax Assessment Total Assessment is a certain percentage of the fair market value that is determined by local assessors to be the total taxable value of land and additions on the property. | Land | Improvement |
|---|---|---|---|---|
| 2024 | $7,882 | $29,000 | $6,006 | $22,994 |
| 2023 | $7,597 | $29,000 | $6,006 | $22,994 |
| 2022 | $7,597 | $29,000 | $6,006 | $22,994 |
| 2021 | $6,340 | $22,252 | $5,755 | $16,497 |
| 2020 | $6,266 | $22,252 | $5,755 | $16,497 |
| 2019 | $6,155 | $24,453 | $5,755 | $18,698 |
| 2018 | $6,525 | $23,446 | $4,754 | $18,692 |
| 2017 | $6,428 | $23,446 | $4,754 | $18,692 |
| 2016 | $6,241 | $23,446 | $4,754 | $18,692 |
| 2015 | $5,547 | $19,894 | $4,004 | $15,890 |
| 2014 | $5,466 | $19,894 | $4,004 | $15,890 |
| 2013 | $5,308 | $19,894 | $4,004 | $15,890 |
Source: Public Records
Map
Nearby Homes
- 1735 Highland Blvd
- 130 Crest Wood Ct Unit 1
- 1345 Jefferson Rd
- 100 White Oak Ct Unit 3
- 1440 Dennison Rd
- 123 Willow Brook Ct Unit 3
- 75 Kristin Cir Unit 310
- 75 Kristin Cir Unit 503
- 540 Jamison Ln
- 315 Arbor Glen Blvd
- 1757 Eastwood Ct Unit 6
- 1860 Ashley Rd
- 620 Lafayette Ln
- 1641 Churchill Rd
- 1505 Chartwell Rd
- 1327 Churchill Rd
- 520 Hill Dr Unit 203
- 1195 Meadow Ln Unit 114
- 1195 Meadow Ln Unit 213
- 989 Butter Creek Ct Unit 3NE
- 1575 Jefferson Rd
- 1555 Jefferson Rd
- 1545 Jefferson Rd
- 1585 Jefferson Rd
- 1560 Jefferson Rd
- 1570 Jefferson Rd
- 1535 Jefferson Rd
- 1595 Jefferson Rd
- 1540 Jefferson Rd
- 1580 Jefferson Rd
- 1530 Jefferson Rd
- 1525 Jefferson Rd
- 1590 Jefferson Rd
- 1599 Jefferson Rd
- 385 Frederick Ln
- 1520 Jefferson Rd
- 1565 Highland Blvd
- 1575 Highland Blvd
- 405 Frederick Ln
- 1515 Jefferson Rd