Estimated Value: $73,000 - $519,000
3
Beds
2
Baths
3,204
Sq Ft
$118/Sq Ft
Est. Value
About This Home
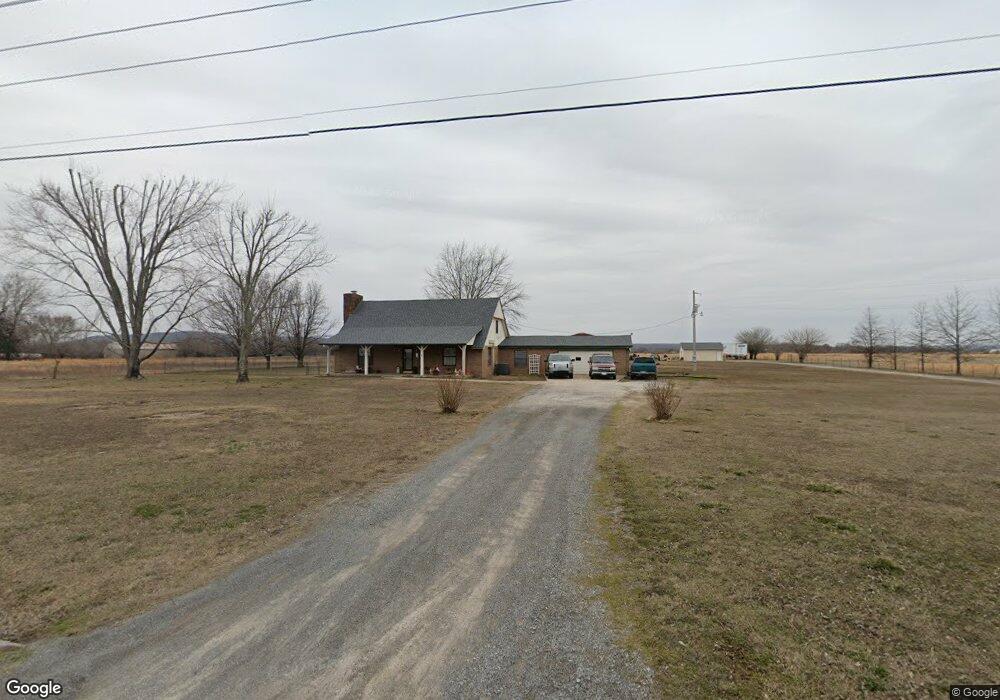
This home is located at 1565 N 428, Pryor, OK 74361 and is currently estimated at $379,094, approximately $118 per square foot. 1565 N 428 is a home located in Mayes County with nearby schools including Osage Public School.
Ownership History
Date
Name
Owned For
Owner Type
Purchase Details
Closed on
Jun 11, 2025
Sold by
Ingram C W
Bought by
Cwi Properties Llc
Current Estimated Value
Purchase Details
Closed on
Jan 8, 2008
Sold by
Ingram C W
Bought by
Garrett George S and Garrett Betty J
Purchase Details
Closed on
Jun 15, 2005
Sold by
Couch Kevin L and Couch Joy E
Bought by
Garrett Betty J and Garrett George S
Home Financials for this Owner
Home Financials are based on the most recent Mortgage that was taken out on this home.
Original Mortgage
$107,400
Interest Rate
7.5%
Mortgage Type
Assumption
Purchase Details
Closed on
Dec 4, 2000
Sold by
Crowson Orvi
Bought by
Couch Kevin and Couch Joy
Purchase Details
Closed on
Aug 20, 1998
Sold by
Fogg Ira Etal
Bought by
Crowson Orvis
Purchase Details
Closed on
Feb 14, 1997
Sold by
Scott Stephen R and Scott
Bought by
Fogg Ira M and Fogg Jr
Create a Home Valuation Report for This Property
The Home Valuation Report is an in-depth analysis detailing your home's value as well as a comparison with similar homes in the area
Home Values in the Area
Average Home Value in this Area
Purchase History
| Date | Buyer | Sale Price | Title Company |
|---|---|---|---|
| Cwi Properties Llc | -- | None Listed On Document | |
| Cwi Properties Llc | -- | None Listed On Document | |
| Garrett George S | $14,500 | None Available | |
| Garrett George S | $14,500 | None Available | |
| Garrett Betty J | $179,000 | None Available | |
| Couch Kevin | $133,000 | -- | |
| Crowson Orvis | $120,000 | -- | |
| Fogg Ira M | $99,500 | -- |
Source: Public Records
Mortgage History
| Date | Status | Borrower | Loan Amount |
|---|---|---|---|
| Previous Owner | Garrett Betty J | $107,400 |
Source: Public Records
Tax History Compared to Growth
Tax History
| Year | Tax Paid | Tax Assessment Tax Assessment Total Assessment is a certain percentage of the fair market value that is determined by local assessors to be the total taxable value of land and additions on the property. | Land | Improvement |
|---|---|---|---|---|
| 2025 | $600 | $8,960 | $8,960 | $0 |
| 2024 | $612 | $8,960 | $8,960 | $0 |
| 2023 | $612 | $29,863 | $4,745 | $25,118 |
| 2022 | $2,176 | $28,993 | $4,525 | $24,468 |
| 2021 | $2,137 | $28,148 | $4,249 | $23,899 |
| 2020 | $2,021 | $27,329 | $4,129 | $23,200 |
| 2019 | $2,013 | $26,533 | $3,829 | $22,704 |
| 2018 | $1,962 | $25,760 | $3,525 | $22,235 |
| 2017 | $1,980 | $25,009 | $3,181 | $21,828 |
| 2016 | $1,894 | $24,282 | $3,089 | $21,193 |
| 2015 | $1,854 | $23,575 | $2,999 | $20,576 |
| 2014 | $1,797 | $22,888 | $2,746 | $20,142 |
Source: Public Records
Map
Nearby Homes
- 1488 N 429
- 130 Sun Prairie St
- 240 NW 482 Trail
- 0 Sun Prairie St Unit 2518981
- 175 S 428
- 0 Polk Cir
- 0 Frances Ln Unit 2518971
- 0 Frances Ln Unit 2518975
- 1523 N 426 Rd
- 192 Prairie Dr
- 9050 W 480
- 104 S 429
- 315 Prairie Dr
- 1825 N 4257 Rd
- 5868 W 493
- 3751 N 427
- 3031 N 430
- 426 N 426 Rd
- 956 Blue Bird Ln
- 4455 N 428