Estimated Value: $343,000 - $356,000
--
Bed
--
Bath
--
Sq Ft
2.6
Acres
About This Home
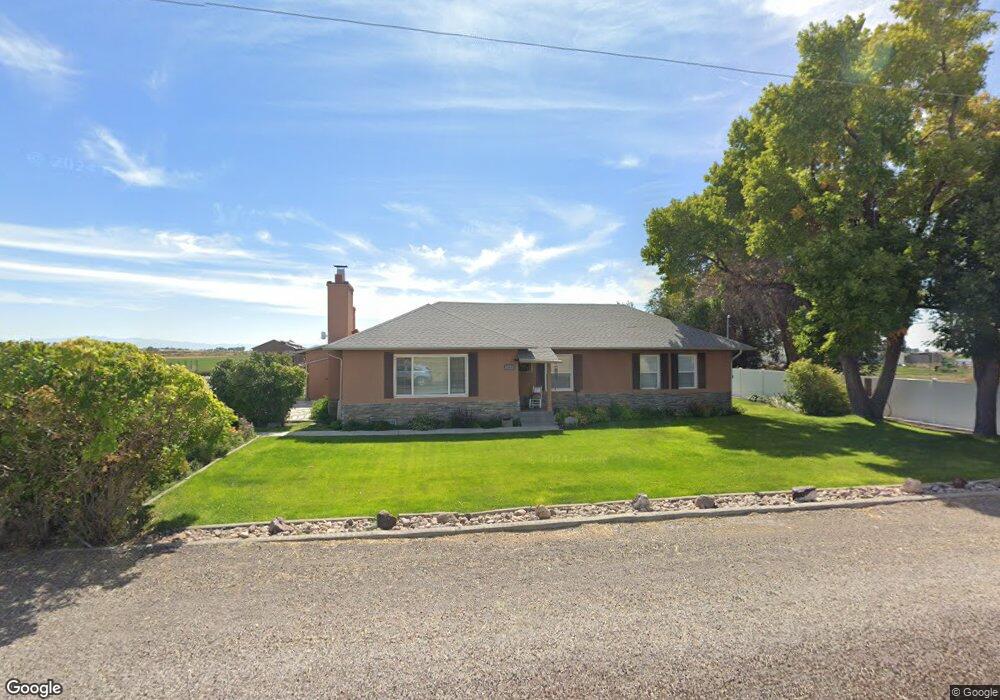
This home is located at 1565 W 1500 N, Delta, UT 84624 and is currently estimated at $351,584. 1565 W 1500 N is a home with nearby schools including Cba Center and White River Academy.
Ownership History
Date
Name
Owned For
Owner Type
Purchase Details
Closed on
Oct 7, 2024
Sold by
Black Crisanne L
Bought by
Riding Reygan S
Current Estimated Value
Home Financials for this Owner
Home Financials are based on the most recent Mortgage that was taken out on this home.
Original Mortgage
$20,560
Outstanding Balance
$20,560
Interest Rate
6.46%
Estimated Equity
$236,940
Purchase Details
Closed on
Sep 19, 2024
Sold by
Black Crisanne L and Bunker Brett C
Bought by
Black Crisanne L and Bunker Dana L
Home Financials for this Owner
Home Financials are based on the most recent Mortgage that was taken out on this home.
Original Mortgage
$20,560
Outstanding Balance
$20,560
Interest Rate
6.46%
Estimated Equity
$236,940
Purchase Details
Closed on
Sep 12, 2024
Sold by
Black Michael Leroy
Bought by
Black Crisanne L
Home Financials for this Owner
Home Financials are based on the most recent Mortgage that was taken out on this home.
Original Mortgage
$20,560
Outstanding Balance
$20,560
Interest Rate
6.46%
Estimated Equity
$236,940
Create a Home Valuation Report for This Property
The Home Valuation Report is an in-depth analysis detailing your home's value as well as a comparison with similar homes in the area
Home Values in the Area
Average Home Value in this Area
Purchase History
Date | Buyer | Sale Price | Title Company |
---|---|---|---|
Riding Reygan S | -- | First American Title Insurance | |
Black Crisanne L | -- | None Listed On Document |
Source: Public Records
Mortgage History
Date | Status | Borrower | Loan Amount |
---|---|---|---|
Open | Riding Reygan S | $20,560 | |
Open | Riding Reygan S | $342,678 | |
Previous Owner | Black Michael L | $100,000 | |
Previous Owner | Black Michael L | $70,000 | |
Previous Owner | Black Michael L | $50,000 |
Source: Public Records
Tax History Compared to Growth
Tax History
Year | Tax Paid | Tax Assessment Tax Assessment Total Assessment is a certain percentage of the fair market value that is determined by local assessors to be the total taxable value of land and additions on the property. | Land | Improvement |
---|---|---|---|---|
2024 | $147,547 | $147,547 | $14,582 | $132,965 |
2023 | $147,547 | $147,547 | $14,582 | $132,965 |
2022 | $1,120 | $99,308 | $14,550 | $84,758 |
2021 | $882 | $75,524 | $12,900 | $62,624 |
2020 | $848 | $73,095 | $12,900 | $60,195 |
2019 | $818 | $71,206 | $12,900 | $58,306 |
2018 | $667 | $59,499 | $12,900 | $46,599 |
2017 | $657 | $56,199 | $9,600 | $46,599 |
2016 | $628 | $56,199 | $9,600 | $46,599 |
2015 | $627 | $56,199 | $9,600 | $46,599 |
2014 | -- | $56,199 | $9,600 | $46,599 |
2013 | -- | $46,667 | $9,600 | $37,067 |
Source: Public Records
Map
Nearby Homes