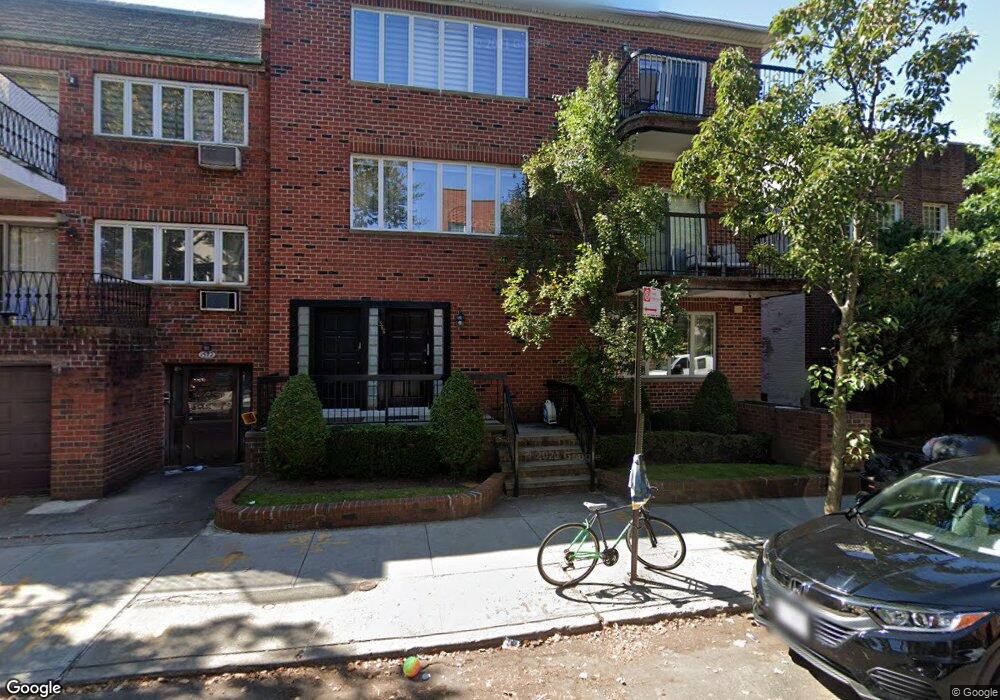
1566 58th St Unit 2 Brooklyn, NY 11219
Borough Park NeighborhoodEstimated Value: $1,222,000 - $1,638,000
--
Bed
--
Bath
1,983
Sq Ft
$694/Sq Ft
Est. Value
About This Home
This home is located at 1566 58th St Unit 2, Brooklyn, NY 11219 and is currently estimated at $1,376,923, approximately $694 per square foot. 1566 58th St Unit 2 is a home located in Kings County with nearby schools including The Seeall Academy, Junior High School 227 Edward B Shallow, and Franklin Delano Roosevelt High School.
Ownership History
Date
Name
Owned For
Owner Type
Purchase Details
Closed on
Aug 25, 2003
Sold by
Weinberger Sarah and Weinberger Schraga
Bought by
Weinberger Sarah
Current Estimated Value
Home Financials for this Owner
Home Financials are based on the most recent Mortgage that was taken out on this home.
Original Mortgage
$215,000
Interest Rate
5.62%
Mortgage Type
Purchase Money Mortgage
Create a Home Valuation Report for This Property
The Home Valuation Report is an in-depth analysis detailing your home's value as well as a comparison with similar homes in the area
Home Values in the Area
Average Home Value in this Area
Purchase History
| Date | Buyer | Sale Price | Title Company |
|---|---|---|---|
| Weinberger Sarah | -- | -- | |
| Weinberger Sarah | -- | -- |
Source: Public Records
Mortgage History
| Date | Status | Borrower | Loan Amount |
|---|---|---|---|
| Closed | Weinberger Sarah | $215,000 |
Source: Public Records
Tax History Compared to Growth
Tax History
| Year | Tax Paid | Tax Assessment Tax Assessment Total Assessment is a certain percentage of the fair market value that is determined by local assessors to be the total taxable value of land and additions on the property. | Land | Improvement |
|---|---|---|---|---|
| 2025 | $5,813 | $71,361 | $3,554 | $67,807 |
| 2024 | $5,813 | $65,716 | $3,554 | $62,162 |
| 2023 | $5,545 | $74,143 | $3,554 | $70,589 |
| 2022 | $5,142 | $68,356 | $3,554 | $64,802 |
| 2021 | $5,114 | $63,827 | $3,554 | $60,273 |
| 2020 | $2,542 | $51,103 | $3,554 | $47,549 |
| 2019 | $5,045 | $51,103 | $3,554 | $47,549 |
| 2018 | $4,638 | $22,752 | $1,703 | $21,049 |
| 2017 | $4,376 | $21,465 | $1,734 | $19,731 |
| 2016 | $4,048 | $20,251 | $2,145 | $18,106 |
| 2015 | $2,442 | $20,251 | $2,444 | $17,807 |
| 2014 | $2,442 | $20,098 | $2,911 | $17,187 |
Source: Public Records
Map
Nearby Homes