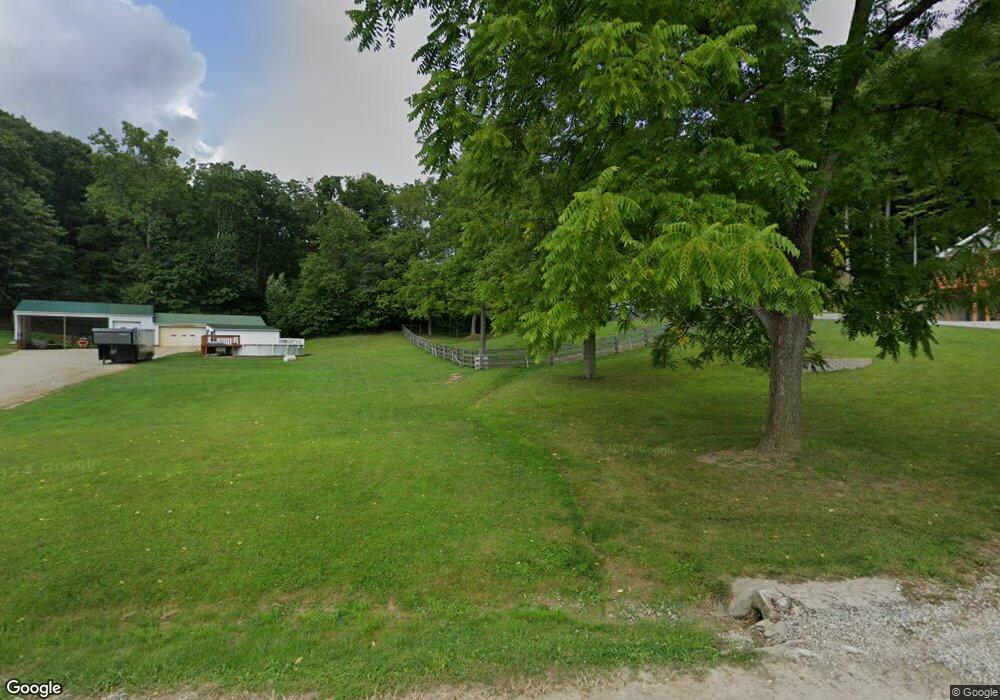
1566 Bull Creek Rd Laurelville, OH 43135
Estimated Value: $223,000 - $337,000
3
Beds
2
Baths
1,196
Sq Ft
$223/Sq Ft
Est. Value
About This Home
This home is located at 1566 Bull Creek Rd, Laurelville, OH 43135 and is currently estimated at $267,048, approximately $223 per square foot. 1566 Bull Creek Rd is a home located in Ross County with nearby schools including Zane Trace Elementary School, Zane Trace Middle School, and Zane Trace High School.
Ownership History
Date
Name
Owned For
Owner Type
Purchase Details
Closed on
Apr 12, 2023
Sold by
Benson Margie K Le
Bought by
Adams Jamey L and Adams Misty D
Current Estimated Value
Purchase Details
Closed on
Jan 6, 2005
Sold by
Chaffin Mark R
Bought by
Chaffin Nina Marie and Benson Margie K
Home Financials for this Owner
Home Financials are based on the most recent Mortgage that was taken out on this home.
Original Mortgage
$22,000
Interest Rate
5.9%
Mortgage Type
Credit Line Revolving
Purchase Details
Closed on
Oct 21, 2002
Bought by
Benson Margie K Le Rem To Chaf Fin
Purchase Details
Closed on
Jul 11, 2000
Bought by
Benson Margie K Le Rem To Chaf Fin
Purchase Details
Closed on
Jan 11, 2000
Bought by
Benson Margie K Le Rem To Chaf Fin
Purchase Details
Closed on
Sep 18, 1998
Bought by
Benson Margie K Le Rem To Chaf Fin
Create a Home Valuation Report for This Property
The Home Valuation Report is an in-depth analysis detailing your home's value as well as a comparison with similar homes in the area
Home Values in the Area
Average Home Value in this Area
Purchase History
| Date | Buyer | Sale Price | Title Company |
|---|---|---|---|
| Adams Jamey L | $180,000 | None Listed On Document | |
| Adams Jamey L | $180,000 | None Listed On Document | |
| Chaffin Nina Marie | -- | None Available | |
| Benson Margie K Le Rem To Chaf Fin | -- | -- | |
| Benson Margie K Le Rem To Chaf Fin | -- | -- | |
| Benson Margie K Le Rem To Chaf Fin | -- | -- | |
| Benson Margie K Le Rem To Chaf Fin | -- | -- |
Source: Public Records
Mortgage History
| Date | Status | Borrower | Loan Amount |
|---|---|---|---|
| Previous Owner | Chaffin Nina Marie | $22,000 |
Source: Public Records
Tax History Compared to Growth
Tax History
| Year | Tax Paid | Tax Assessment Tax Assessment Total Assessment is a certain percentage of the fair market value that is determined by local assessors to be the total taxable value of land and additions on the property. | Land | Improvement |
|---|---|---|---|---|
| 2024 | $2,386 | $67,870 | $7,750 | $60,120 |
| 2023 | $2,386 | $67,830 | $7,750 | $60,080 |
| 2022 | $2,075 | $67,830 | $7,750 | $60,080 |
| 2021 | $1,739 | $54,690 | $5,570 | $49,120 |
| 2020 | $1,738 | $54,690 | $5,570 | $49,120 |
| 2019 | $1,739 | $54,690 | $5,570 | $49,120 |
| 2018 | $1,531 | $47,610 | $4,590 | $43,020 |
| 2017 | $1,565 | $47,610 | $4,590 | $43,020 |
| 2016 | $1,526 | $47,610 | $4,590 | $43,020 |
| 2015 | $1,481 | $46,360 | $4,590 | $41,770 |
| 2014 | $1,446 | $46,360 | $4,590 | $41,770 |
| 2013 | $1,453 | $46,360 | $4,590 | $41,770 |
Source: Public Records
Map
Nearby Homes
- 0 St Rt 327
- 4 Sams Creek Rd
- 0 Sam's Creek Rd Unit 225006076
- 22916 Sams Creek Rd
- 0 Luckhart Rd
- 15437 Charleston Pike
- 23411 Ohio 327
- 0 Sams Creek Rd
- 23769 State Route 327
- 23858 State Route 327
- 11988 Main St
- 30851 State Route 180
- 16946 Ohio 56
- 0 Bellia Rd
- 13730 Marietta Rd
- 0 Thomas Rd Unit 225024288
- 6328 Ohio 180
- 7135 Walnut Creek Rd
- 0 State Route 327 Unit 225031635
- 23865 Pole Ridge Rd
- 1562 Bull Creek Rd
- 1476 Bull Creek Rd
- 1626 Bull Creek Rd
- 1662 Bull Creek Rd
- 1603 Bull Creek Rd
- 1814 Bull Creek Rd
- 1569 Bull Creek Rd
- 1768 Bull Creek Rd
- 1696 Bull Creek Rd
- 1284 Bull Creek Rd
- 1284 Bull Creek Rd
- 1796 Bull Creek Rd
- 1279 Bull Creek Rd
- 1279 Bull Creek Rd
- 1820 Bull Creek Rd
- 1244 Bull Creek Rd
- 1795 Bull Creek Rd
- 1843 Bull Creek Rd
- 1251 Bull Creek Rd
- 1879 Bull Creek Rd