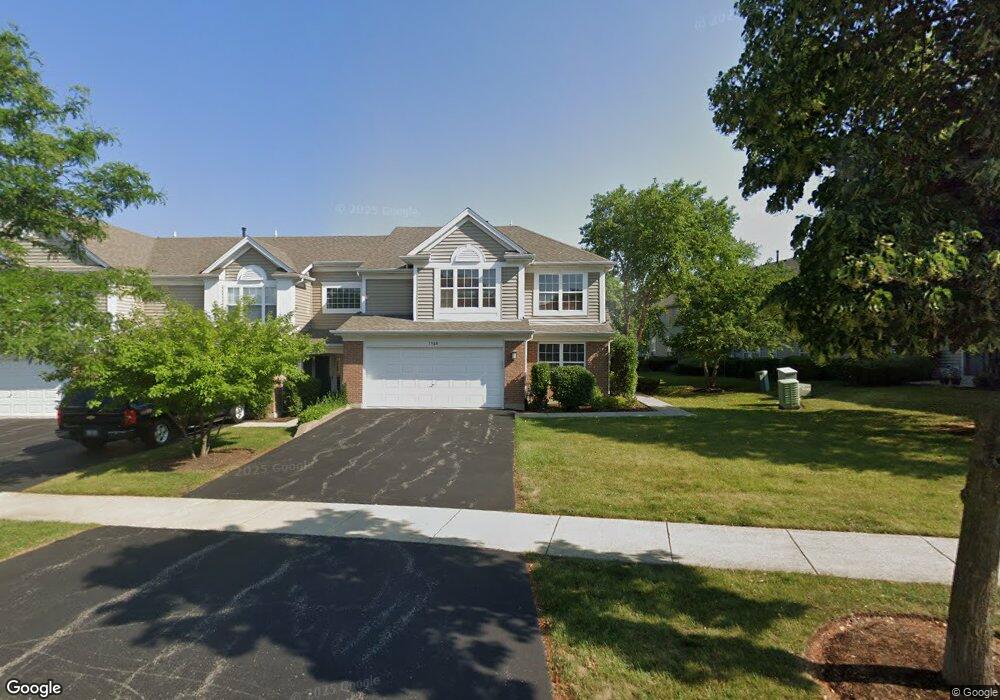
1566 E Baronet Ln Unit 130310 Palatine, IL 60074
Estimated Value: $342,785 - $397,000
2
Beds
3
Baths
1,500
Sq Ft
$242/Sq Ft
Est. Value
About This Home
This home is located at 1566 E Baronet Ln Unit 130310, Palatine, IL 60074 and is currently estimated at $363,196, approximately $242 per square foot. 1566 E Baronet Ln Unit 130310 is a home located in Cook County with nearby schools including Winston Campus Elementary School, Palatine High School, and St Peter Lutheran School.
Ownership History
Date
Name
Owned For
Owner Type
Purchase Details
Closed on
Oct 19, 2017
Sold by
Loster Leonard and Loster Kia
Bought by
Bergren Jason
Current Estimated Value
Home Financials for this Owner
Home Financials are based on the most recent Mortgage that was taken out on this home.
Original Mortgage
$206,625
Outstanding Balance
$173,960
Interest Rate
4.12%
Mortgage Type
New Conventional
Estimated Equity
$189,236
Purchase Details
Closed on
Aug 29, 1997
Sold by
Bracken Ryan T
Bought by
Present Jeffrey A and Lewis Wendy D
Home Financials for this Owner
Home Financials are based on the most recent Mortgage that was taken out on this home.
Original Mortgage
$126,000
Interest Rate
7.63%
Purchase Details
Closed on
Jul 8, 1996
Sold by
Cole Taylor Bank
Bought by
Bracken Ryan T
Home Financials for this Owner
Home Financials are based on the most recent Mortgage that was taken out on this home.
Original Mortgage
$149,000
Interest Rate
8.3%
Mortgage Type
FHA
Create a Home Valuation Report for This Property
The Home Valuation Report is an in-depth analysis detailing your home's value as well as a comparison with similar homes in the area
Home Values in the Area
Average Home Value in this Area
Purchase History
| Date | Buyer | Sale Price | Title Company |
|---|---|---|---|
| Bergren Jason | $217,500 | Citywide Title Corporation | |
| Present Jeffrey A | $105,333 | -- | |
| Bracken Ryan T | $153,500 | Ticor Title Insurance |
Source: Public Records
Mortgage History
| Date | Status | Borrower | Loan Amount |
|---|---|---|---|
| Open | Bergren Jason | $206,625 | |
| Previous Owner | Present Jeffrey A | $126,000 | |
| Previous Owner | Bracken Ryan T | $149,000 |
Source: Public Records
Tax History Compared to Growth
Tax History
| Year | Tax Paid | Tax Assessment Tax Assessment Total Assessment is a certain percentage of the fair market value that is determined by local assessors to be the total taxable value of land and additions on the property. | Land | Improvement |
|---|---|---|---|---|
| 2024 | $6,046 | $23,408 | $4,256 | $19,152 |
| 2023 | $5,872 | $23,408 | $4,256 | $19,152 |
| 2022 | $5,872 | $23,408 | $4,256 | $19,152 |
| 2021 | $5,202 | $18,787 | $2,659 | $16,128 |
| 2020 | $5,188 | $18,787 | $2,659 | $16,128 |
| 2019 | $5,580 | $22,231 | $2,659 | $19,572 |
| 2018 | $5,954 | $18,331 | $2,393 | $15,938 |
| 2017 | $4,767 | $18,331 | $2,393 | $15,938 |
| 2016 | $4,703 | $18,331 | $2,393 | $15,938 |
| 2015 | $4,620 | $16,966 | $2,127 | $14,839 |
| 2014 | $4,588 | $16,966 | $2,127 | $14,839 |
| 2013 | $4,761 | $17,948 | $2,127 | $15,821 |
Source: Public Records
Map
Nearby Homes
- 1542 E Baronet Ln Unit 120300
- 1539 E Baronet Ln Unit 130420
- 1750 W Thomas St
- 1605 N Chicago Ave
- 1326 N Race Ave
- 543 S Warren Ave
- 1417 E Joyce Ave
- 1416 W Lynnwood Ave
- 1418 W Maude Ave
- 628 S Wilke Rd
- 1518 N Patton Ave
- 111 S Baybrook Dr Unit 114
- 111 S Baybrook Dr Unit 514
- 1422 E Dorothy Dr
- 105 S Stonington Dr Unit 304
- 45 S Stonington Dr Unit 4
- 263 S Clubhouse Dr Unit 104
- 945 E Kenilworth Ave Unit 312
- 945 E Kenilworth Ave Unit 318
- 945 E Kenilworth Ave Unit 429
- 1568 E Baronet Ln Unit 130310
- 340 S Valor Ct Unit 130320
- 338 S Valor Ct Unit 130320
- 344 S Valor Ct Unit 130320
- 1557 E Chivalry Ct Unit 40140
- 1559 E Chivalry Ct Unit 40140
- 1564 E Baronet Ln Unit 130310
- 1561 E Chivalry Ct Unit 40140
- 1562 E Baronet Ln Unit 130310
- 342 S Valor Ct Unit 130320
- 326 S Valor Ct Unit 140330
- 1549 E Chivalry Ct Unit 50150
- 1560 E Baronet Ln Unit 130310
- 1565 E Baronet Ln Unit 150400
- 1547 E Chivalry Ct Unit 50150
- 324 S Valor Ct Unit 140330
- 1563 E Baronet Ln Unit 150400
- 364 S Crown Ct Unit 160390
- 1548 E Baronet Ln Unit 120300
- 1564 E Chivalry Ct Unit 40130