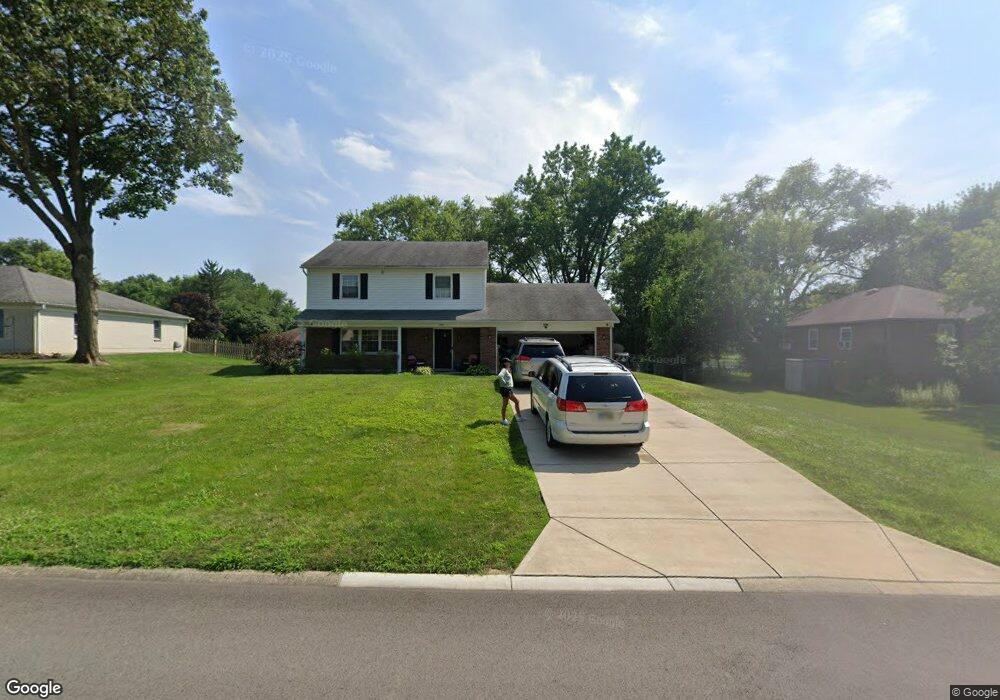
1566 Lindenhurst Dr Dayton, OH 45459
Woodbourne-Hyde Park NeighborhoodEstimated Value: $374,408 - $425,000
4
Beds
3
Baths
2,403
Sq Ft
$164/Sq Ft
Est. Value
About This Home
This home is located at 1566 Lindenhurst Dr, Dayton, OH 45459 and is currently estimated at $394,102, approximately $164 per square foot. 1566 Lindenhurst Dr is a home located in Montgomery County with nearby schools including Primary Village North, Normandy Elementary School, and Hadley E Watts Middle School.
Ownership History
Date
Name
Owned For
Owner Type
Purchase Details
Closed on
Mar 15, 2018
Sold by
Tith Dara N
Bought by
Tith Emily N
Current Estimated Value
Home Financials for this Owner
Home Financials are based on the most recent Mortgage that was taken out on this home.
Original Mortgage
$133,000
Outstanding Balance
$113,558
Interest Rate
4.32%
Mortgage Type
New Conventional
Estimated Equity
$280,544
Purchase Details
Closed on
Sep 27, 2013
Sold by
Weis Michele R and Hall Michele R
Bought by
Tith Dara N and Tith Emily N
Home Financials for this Owner
Home Financials are based on the most recent Mortgage that was taken out on this home.
Original Mortgage
$145,200
Interest Rate
4.56%
Mortgage Type
Future Advance Clause Open End Mortgage
Purchase Details
Closed on
Feb 10, 2006
Sold by
Bathija Prakash R and Bathija Roma P
Bought by
Hall Michele R
Home Financials for this Owner
Home Financials are based on the most recent Mortgage that was taken out on this home.
Original Mortgage
$141,900
Interest Rate
6.2%
Mortgage Type
Purchase Money Mortgage
Create a Home Valuation Report for This Property
The Home Valuation Report is an in-depth analysis detailing your home's value as well as a comparison with similar homes in the area
Home Values in the Area
Average Home Value in this Area
Purchase History
| Date | Buyer | Sale Price | Title Company |
|---|---|---|---|
| Tith Emily N | -- | Landmark Title Agency South | |
| Tith Dara N | $181,500 | Partners Land Title Agency | |
| Hall Michele R | $177,500 | Advanced Land Title Agency |
Source: Public Records
Mortgage History
| Date | Status | Borrower | Loan Amount |
|---|---|---|---|
| Open | Tith Emily N | $133,000 | |
| Closed | Tith Dara N | $145,200 | |
| Closed | Hall Michele R | $141,900 |
Source: Public Records
Tax History Compared to Growth
Tax History
| Year | Tax Paid | Tax Assessment Tax Assessment Total Assessment is a certain percentage of the fair market value that is determined by local assessors to be the total taxable value of land and additions on the property. | Land | Improvement |
|---|---|---|---|---|
| 2024 | $6,508 | $105,610 | $15,330 | $90,280 |
| 2023 | $6,508 | $105,610 | $15,330 | $90,280 |
| 2022 | $6,307 | $80,970 | $11,800 | $69,170 |
| 2021 | $6,324 | $80,970 | $11,800 | $69,170 |
| 2020 | $6,315 | $80,970 | $11,800 | $69,170 |
| 2019 | $5,845 | $66,950 | $11,800 | $55,150 |
| 2018 | $5,221 | $66,950 | $11,800 | $55,150 |
| 2017 | $5,165 | $66,950 | $11,800 | $55,150 |
| 2016 | $5,023 | $61,360 | $11,800 | $49,560 |
| 2015 | $4,942 | $61,360 | $11,800 | $49,560 |
| 2014 | $4,942 | $61,360 | $11,800 | $49,560 |
| 2012 | -- | $47,380 | $10,010 | $37,370 |
Source: Public Records
Map
Nearby Homes
- 1241 Agate Trail
- 1553 Roamont Dr
- 1221 Wood Mill Trail
- 1208 Hidden Oaks Dr
- 7610 Kings Run Rd
- 1817 Provincetown Rd
- 7325 Eagle Creek Dr
- 9211 Bottega - South Dr Unit 67
- 1931 Alda Ct
- 7806 Washington Park Dr
- 901 Olde Sterling Way
- 1464 W Alex Bell Rd
- 7853 Betsy Ross Cir Unit 11
- 950 Olde Sterling Way
- 6630 Carinthia Dr
- 6401 Broken Arrow Place
- 1070 Foxshire Place
- 6561 Fieldson Rd
- 1909 Washington Dr N
- 1901 Washington Dr N
- 1560 Lindenhurst Dr
- 1572 Lindenhurst Dr
- 1479 Beaushire Cir
- 1554 Lindenhurst Dr
- 1563 Lindenhurst Dr
- 1569 Lindenhurst Dr
- 1578 Lindenhurst Dr
- 1557 Lindenhurst Dr
- 1471 Beaushire Cir
- 7250 Southpoint Dr
- 1548 Lindenhurst Dr
- 1551 Lindenhurst Dr
- 1575 Lindenhurst Dr
- 1501 Penbrooke Trail
- 1461 Beaushire Cir
- 1410 Roamont Dr
- 1480 Beaushire Cir
- 7170 Southpoint Dr
- 1545 Lindenhurst Dr
- 1424 Roamont Dr