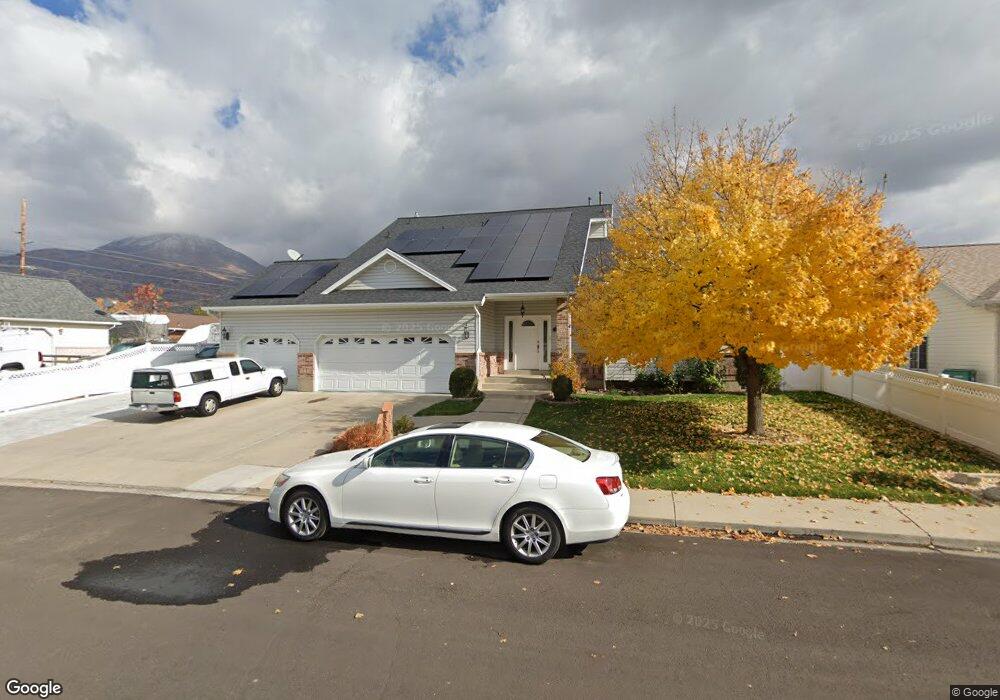
1566 N 740 W Orem, UT 84057
Bonneville NeighborhoodEstimated Value: $666,000 - $742,000
6
Beds
4
Baths
3,807
Sq Ft
$185/Sq Ft
Est. Value
About This Home
This home is located at 1566 N 740 W, Orem, UT 84057 and is currently estimated at $703,021, approximately $184 per square foot. 1566 N 740 W is a home located in Utah County with nearby schools including Bonneville Elementary School, Orem Junior High School, and Timpanogos High School.
Ownership History
Date
Name
Owned For
Owner Type
Purchase Details
Closed on
Oct 28, 2020
Sold by
Patel Nagin K and Patel Kala N
Bought by
Larsen Brent Lee and Larsen Jean Yvonne
Current Estimated Value
Home Financials for this Owner
Home Financials are based on the most recent Mortgage that was taken out on this home.
Original Mortgage
$510,400
Outstanding Balance
$454,183
Interest Rate
2.8%
Mortgage Type
New Conventional
Estimated Equity
$248,838
Purchase Details
Closed on
Mar 6, 2019
Sold by
Patel Nagin K and Patel Kalavati N
Bought by
Patel Nagin K and Patel Kala N
Purchase Details
Closed on
Mar 31, 2003
Sold by
Patel Kalavati N
Bought by
Patel Nagin K and Patel Kalavati N
Home Financials for this Owner
Home Financials are based on the most recent Mortgage that was taken out on this home.
Original Mortgage
$139,500
Interest Rate
5.78%
Create a Home Valuation Report for This Property
The Home Valuation Report is an in-depth analysis detailing your home's value as well as a comparison with similar homes in the area
Home Values in the Area
Average Home Value in this Area
Purchase History
| Date | Buyer | Sale Price | Title Company |
|---|---|---|---|
| Larsen Brent Lee | -- | Metro National Title | |
| Patel Nagin K | -- | None Available | |
| Patel Nagin K | -- | Precision Title Company | |
| Patel Kalavati N | -- | Precision Title Company |
Source: Public Records
Mortgage History
| Date | Status | Borrower | Loan Amount |
|---|---|---|---|
| Open | Larsen Brent Lee | $510,400 | |
| Previous Owner | Patel Kalavati N | $139,500 |
Source: Public Records
Tax History Compared to Growth
Tax History
| Year | Tax Paid | Tax Assessment Tax Assessment Total Assessment is a certain percentage of the fair market value that is determined by local assessors to be the total taxable value of land and additions on the property. | Land | Improvement |
|---|---|---|---|---|
| 2025 | $2,481 | $342,485 | $195,900 | $426,800 |
| 2024 | $2,481 | $303,380 | $0 | $0 |
| 2023 | $2,280 | $299,640 | $0 | $0 |
| 2022 | $2,294 | $292,105 | $0 | $0 |
| 2021 | $2,139 | $412,500 | $153,000 | $259,500 |
| 2020 | $1,925 | $364,800 | $122,400 | $242,400 |
| 2019 | $1,851 | $364,800 | $122,400 | $242,400 |
| 2018 | $1,782 | $335,600 | $111,900 | $223,700 |
| 2017 | $1,708 | $172,315 | $0 | $0 |
| 2016 | $1,803 | $167,750 | $0 | $0 |
| 2015 | $1,699 | $149,490 | $0 | $0 |
| 2014 | $1,613 | $141,240 | $0 | $0 |
Source: Public Records
Map
Nearby Homes
- 1561 N 740 W
- 613 W 1550 N
- 697 W 1400 N
- 1545 N State St Unit 11
- 1482 N 550 St W Unit 18
- 597 W 1400 N
- 1415 N 550 West St
- 582 W 1300 N
- 856 W 1840 N
- 1455 N Amiron Way Unit A
- 1438 N Amiron Way Unit B
- 1584 N 1150 W
- 1554 N 1150 W
- 332 W Amiron Way Unit D
- 1527 N 275 St W Unit 4
- 1543 N 275 St W Unit 2
- 1531 N 275 St W Unit 3
- 1570 N 275 St W
- 1557 N 275 St W Unit 1
- 1542 N 275 St W Unit 5