Estimated Value: $151,000 - $189,068
3
Beds
1
Bath
1,141
Sq Ft
$150/Sq Ft
Est. Value
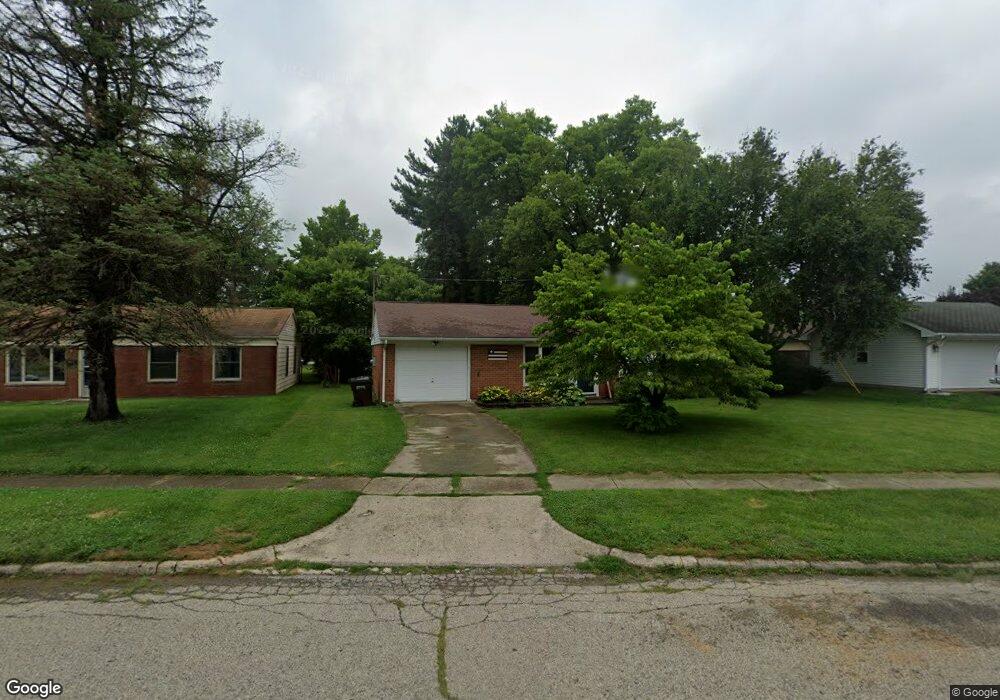
About This Home
This home is located at 1566 Reid Ave, Xenia, OH 45385 and is currently estimated at $171,017, approximately $149 per square foot. 1566 Reid Ave is a home located in Greene County with nearby schools including Xenia High School, Summit Academy Community School for Alternative Learners - Xenia, and Legacy Christian Academy.
Ownership History
Date
Name
Owned For
Owner Type
Purchase Details
Closed on
Jun 1, 2022
Sold by
Quattrone Joshua R and Quattrone Karissa
Bought by
Current Hannah C and Current Jordan L
Current Estimated Value
Home Financials for this Owner
Home Financials are based on the most recent Mortgage that was taken out on this home.
Original Mortgage
$94,914
Outstanding Balance
$79,297
Interest Rate
4.4%
Mortgage Type
New Conventional
Estimated Equity
$91,720
Purchase Details
Closed on
Sep 22, 2008
Sold by
Brenneison Jean Alkins
Bought by
Quattrone Joshua R and Quattrone Karissa
Home Financials for this Owner
Home Financials are based on the most recent Mortgage that was taken out on this home.
Original Mortgage
$85,806
Interest Rate
6.52%
Mortgage Type
VA
Purchase Details
Closed on
Jun 16, 1998
Sold by
Estate Of Virginia M Aikins
Bought by
Aikins Harold H
Create a Home Valuation Report for This Property
The Home Valuation Report is an in-depth analysis detailing your home's value as well as a comparison with similar homes in the area
Home Values in the Area
Average Home Value in this Area
Purchase History
| Date | Buyer | Sale Price | Title Company |
|---|---|---|---|
| Current Hannah C | -- | None Listed On Document | |
| Quattrone Joshua R | $84,000 | Attorney | |
| Aikins Harold H | -- | -- |
Source: Public Records
Mortgage History
| Date | Status | Borrower | Loan Amount |
|---|---|---|---|
| Open | Current Hannah C | $94,914 | |
| Previous Owner | Quattrone Joshua R | $85,806 |
Source: Public Records
Tax History Compared to Growth
Tax History
| Year | Tax Paid | Tax Assessment Tax Assessment Total Assessment is a certain percentage of the fair market value that is determined by local assessors to be the total taxable value of land and additions on the property. | Land | Improvement |
|---|---|---|---|---|
| 2024 | $2,097 | $49,000 | $11,740 | $37,260 |
| 2023 | $2,097 | $49,000 | $11,740 | $37,260 |
| 2022 | $1,712 | $34,120 | $8,380 | $25,740 |
| 2021 | $1,735 | $34,120 | $8,380 | $25,740 |
| 2020 | $1,662 | $34,120 | $8,380 | $25,740 |
| 2019 | $1,364 | $26,360 | $6,060 | $20,300 |
| 2018 | $1,369 | $26,360 | $6,060 | $20,300 |
| 2017 | $1,289 | $26,360 | $6,060 | $20,300 |
| 2016 | $1,289 | $24,350 | $6,060 | $18,290 |
| 2015 | $1,293 | $24,350 | $6,060 | $18,290 |
| 2014 | $1,238 | $24,350 | $6,060 | $18,290 |
Source: Public Records
Map
Nearby Homes
- 1391 June Dr
- 1283 June Dr
- 1351 Omard Dr
- 1233 June Dr
- 1223 June Dr
- 1342 Kylemore Dr
- 121 S Progress Dr
- 343 Sheelin Rd
- 1144 Rockwell Dr
- 1568 Cheyenne Dr
- 912 Omard Dr
- 883 Omard Dr
- 509 Antrim Rd
- 1618 Navajo Dr
- 1653 Seneca Dr
- 1208 Bellbrook Ave
- 161 Montana Dr
- 2758 Wyoming Dr
- 1272 Bellbrook Ave
- 305-325 Bellbrook Ave