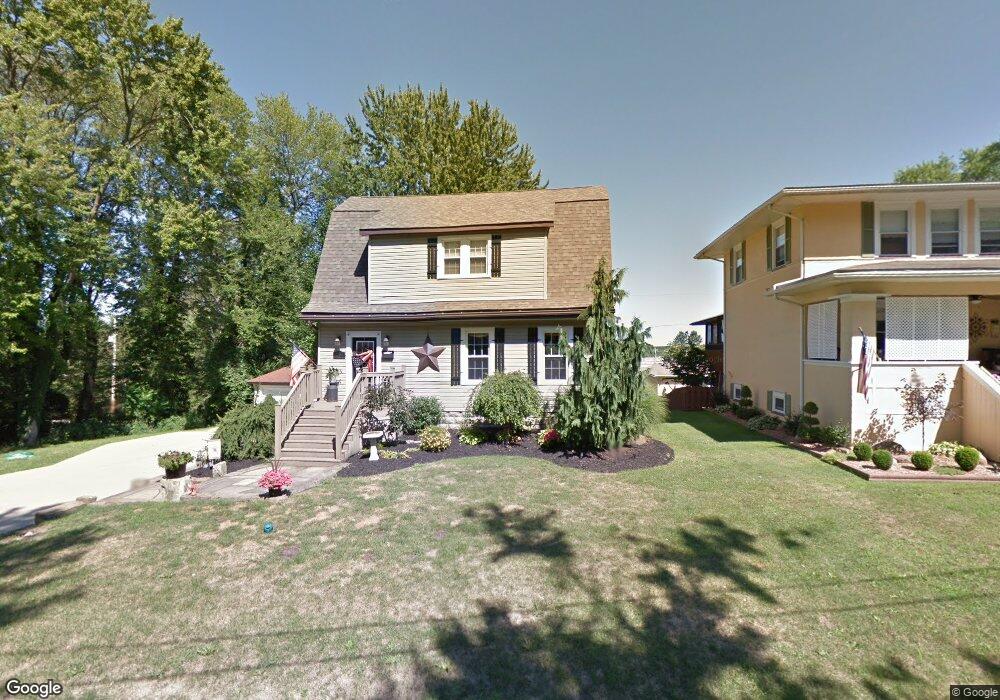
1567 Cullinan Ave Masury, OH 44438
Estimated Value: $94,000 - $165,000
3
Beds
1
Bath
1,320
Sq Ft
$91/Sq Ft
Est. Value
About This Home
This home is located at 1567 Cullinan Ave, Masury, OH 44438 and is currently estimated at $120,267, approximately $91 per square foot. 1567 Cullinan Ave is a home located in Trumbull County with nearby schools including Hubbard Elementary School, Hubbard Middle School, and Hubbard High School.
Ownership History
Date
Name
Owned For
Owner Type
Purchase Details
Closed on
Feb 10, 2005
Sold by
Altiere Thomas L
Bought by
Wukelich Angela
Current Estimated Value
Home Financials for this Owner
Home Financials are based on the most recent Mortgage that was taken out on this home.
Original Mortgage
$45,500
Outstanding Balance
$26,613
Interest Rate
8.12%
Mortgage Type
Adjustable Rate Mortgage/ARM
Estimated Equity
$93,654
Purchase Details
Closed on
Aug 12, 1994
Sold by
Ludwick James R
Bought by
Gilson Dustin L
Home Financials for this Owner
Home Financials are based on the most recent Mortgage that was taken out on this home.
Original Mortgage
$29,300
Interest Rate
8.16%
Mortgage Type
New Conventional
Purchase Details
Closed on
Jan 1, 1990
Bought by
James R Ludwick
Create a Home Valuation Report for This Property
The Home Valuation Report is an in-depth analysis detailing your home's value as well as a comparison with similar homes in the area
Home Values in the Area
Average Home Value in this Area
Purchase History
| Date | Buyer | Sale Price | Title Company |
|---|---|---|---|
| Wukelich Angela | $45,500 | -- | |
| Gilson Dustin L | $34,500 | -- | |
| James R Ludwick | -- | -- |
Source: Public Records
Mortgage History
| Date | Status | Borrower | Loan Amount |
|---|---|---|---|
| Open | Wukelich Angela | $45,500 | |
| Previous Owner | Gilson Dustin L | $29,300 |
Source: Public Records
Tax History Compared to Growth
Tax History
| Year | Tax Paid | Tax Assessment Tax Assessment Total Assessment is a certain percentage of the fair market value that is determined by local assessors to be the total taxable value of land and additions on the property. | Land | Improvement |
|---|---|---|---|---|
| 2024 | $1,640 | $22,620 | $1,860 | $20,760 |
| 2023 | $1,640 | $22,620 | $1,860 | $20,760 |
| 2022 | $1,264 | $19,010 | $1,860 | $17,150 |
| 2021 | $1,270 | $19,010 | $1,860 | $17,150 |
| 2020 | $1,274 | $19,010 | $1,860 | $17,150 |
| 2019 | $1,276 | $18,030 | $1,860 | $16,170 |
| 2018 | $1,240 | $18,030 | $1,860 | $16,170 |
| 2017 | $1,236 | $18,030 | $1,860 | $16,170 |
| 2016 | $1,470 | $18,620 | $2,100 | $16,520 |
| 2015 | $1,253 | $18,620 | $2,100 | $16,520 |
| 2014 | $1,201 | $18,620 | $2,100 | $16,520 |
| 2013 | $1,199 | $18,620 | $2,100 | $16,520 |
Source: Public Records
Map
Nearby Homes
- 1354 Stevenson Rd
- 1952 Hubbard Masury Rd
- 7440 Stewart Sharon Rd
- 928 Bedford Rd
- 7182 Stewart Sharon Rd
- 6976 White Oak Dr
- 766 S Irvine Ave
- 6855 Stewart Sharon Rd
- 545 & 625 Davis St
- 691 S Irvine Ave
- 887 State Route 7 SE
- 506 Spearman Ave
- 807 Lee Ave
- 306 Federal St
- 104 Fruit Ave
- 626 Fruit Ave
- 609 Syme St
- 641 Fruit Ave
- 411 Emerson Ave
- 300 Beechwood Ave
- 1567 Cullinan Ave
- 1561 Cullinan Ave
- 1571 Cullinan Ave
- 1547 Cullinan Ave
- 1581 Cullinan Ave
- 1566 Cullinan Ave
- 1556 Cullinan Ave
- 1541 Cullinan Ave
- 1548 Cullinan Ave
- 1548 Cullinan Ave
- 1576 Cullinan Ave
- 7753 Mcdowell St
- 7753 Mcdowell
- 1586 Cullinan Ave
- 1586 Cullinan Ave
- 1537 Cullinan Ave
- 7757 Mcdowell St
- 1538 Cullinan Ave
- 7763 Mcdowell St
- 7787 Mcdowell St