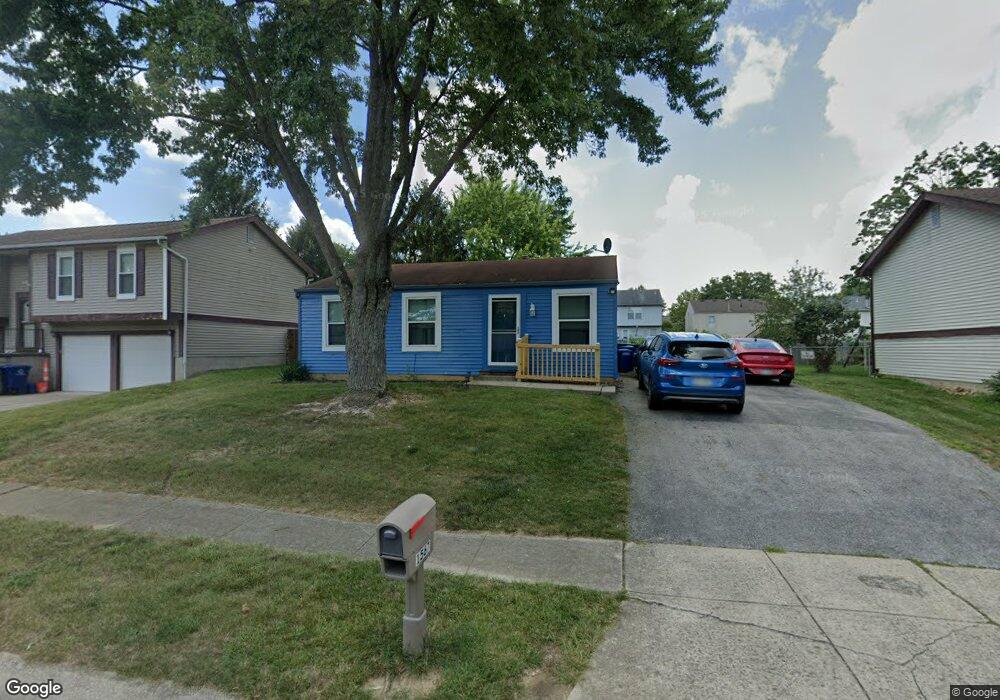
1567 Red Leaf Ln Columbus, OH 43223
Estimated Value: $165,000 - $228,000
3
Beds
1
Bath
896
Sq Ft
$211/Sq Ft
Est. Value
About This Home
This home is located at 1567 Red Leaf Ln, Columbus, OH 43223 and is currently estimated at $189,473, approximately $211 per square foot. 1567 Red Leaf Ln is a home located in Franklin County with nearby schools including Finland Elementary School, Franklin Woods Intermediate School, and Finland Middle School.
Ownership History
Date
Name
Owned For
Owner Type
Purchase Details
Closed on
Mar 5, 2025
Sold by
Clay Lester Scott and Clay Sheryl L
Bought by
Clay Family Living Trust and Clay
Current Estimated Value
Purchase Details
Closed on
Aug 28, 2019
Sold by
Clay Sheryl L and Clay Lester Scott
Bought by
Clay Lester Scott and Clay Sheryl L
Home Financials for this Owner
Home Financials are based on the most recent Mortgage that was taken out on this home.
Original Mortgage
$83,000
Interest Rate
3.6%
Mortgage Type
New Conventional
Purchase Details
Closed on
Mar 22, 2010
Sold by
Clay Lester Scott and Clay Sheryl L
Bought by
Clay Sheryl L
Home Financials for this Owner
Home Financials are based on the most recent Mortgage that was taken out on this home.
Original Mortgage
$102,921
Interest Rate
5.25%
Mortgage Type
FHA
Purchase Details
Closed on
Jul 2, 1982
Bought by
Clay Lester S
Create a Home Valuation Report for This Property
The Home Valuation Report is an in-depth analysis detailing your home's value as well as a comparison with similar homes in the area
Home Values in the Area
Average Home Value in this Area
Purchase History
| Date | Buyer | Sale Price | Title Company |
|---|---|---|---|
| Clay Family Living Trust | -- | None Listed On Document | |
| Clay Lester Scott | -- | None Available | |
| Clay Sheryl L | -- | Peak Title | |
| Clay Lester S | -- | -- |
Source: Public Records
Mortgage History
| Date | Status | Borrower | Loan Amount |
|---|---|---|---|
| Previous Owner | Clay Lester Scott | $83,000 | |
| Previous Owner | Clay Sheryl L | $102,921 |
Source: Public Records
Tax History
| Year | Tax Paid | Tax Assessment Tax Assessment Total Assessment is a certain percentage of the fair market value that is determined by local assessors to be the total taxable value of land and additions on the property. | Land | Improvement |
|---|---|---|---|---|
| 2025 | $2,063 | $56,570 | $20,620 | $35,950 |
| 2024 | $2,063 | $56,570 | $20,620 | $35,950 |
| 2023 | $2,026 | $56,560 | $20,615 | $35,945 |
| 2022 | $1,767 | $36,200 | $10,190 | $26,010 |
| 2021 | $1,802 | $36,200 | $10,190 | $26,010 |
| 2020 | $1,792 | $36,200 | $10,190 | $26,010 |
| 2019 | $1,607 | $28,640 | $8,160 | $20,480 |
| 2018 | $1,540 | $28,640 | $8,160 | $20,480 |
| 2017 | $1,592 | $28,640 | $8,160 | $20,480 |
| 2016 | $1,480 | $24,470 | $4,830 | $19,640 |
| 2015 | $1,480 | $24,470 | $4,830 | $19,640 |
| 2014 | $1,482 | $24,470 | $4,830 | $19,640 |
| 2013 | $774 | $25,760 | $5,075 | $20,685 |
Source: Public Records
Map
Nearby Homes
- 1543 Red Leaf Ln
- 1521 October Ridge Ct
- 1640 Butterfly Ct
- 2210 October Ridge Dr
- 0 S Central Ave
- 1372 Stanwix Ct
- 1834 Saint Lawrence Dr
- 2072 Asher Ct
- 1696 Marsdale Ave
- 1295 Woodbrook Ln Unit 223
- 1208 Woodbrook Ln Unit 307
- 1258 Woodbrook Cir W Unit 199
- 1657 Eastbrook Dr S
- 1625 Eastfield Dr N
- 2375 Woodbrook Cir S Unit 167
- 1949 Big Run Bluffs Blvd
- 2407 Bluff Run Dr
- 2336 Woodbrook Cir N Unit 92 B
- 1173 Woodbrook Cir W Unit 56
- 2348 Woodbrook Cir N Unit F
- 1575 Red Leaf Ln
- 1559 Red Leaf Ln
- 1583 Red Leaf Ln
- 1551 Red Leaf Ln
- 1568 Autumn Village Dr
- 1574 Autumn Village Dr
- 1562 Autumn Village Dr
- 1582 Autumn Village Dr
- 1576 Red Leaf Ln
- 1554 Autumn Village Dr
- 1591 Red Leaf Ln
- 1588 Autumn Village Dr
- 1546 Autumn Village Dr
- 1584 Red Leaf Ln
- 1544 Red Leaf Ln
- 2169 Summer Breeze Dr
- 1594 Autumn Village Dr
- 1594 Autumn Village Dr Unit L-13
- 1612 Autumn Village Dr Unit L-16
- 0 Autumn Village Dr Unit 35245
Your Personal Tour Guide
Ask me questions while you tour the home.