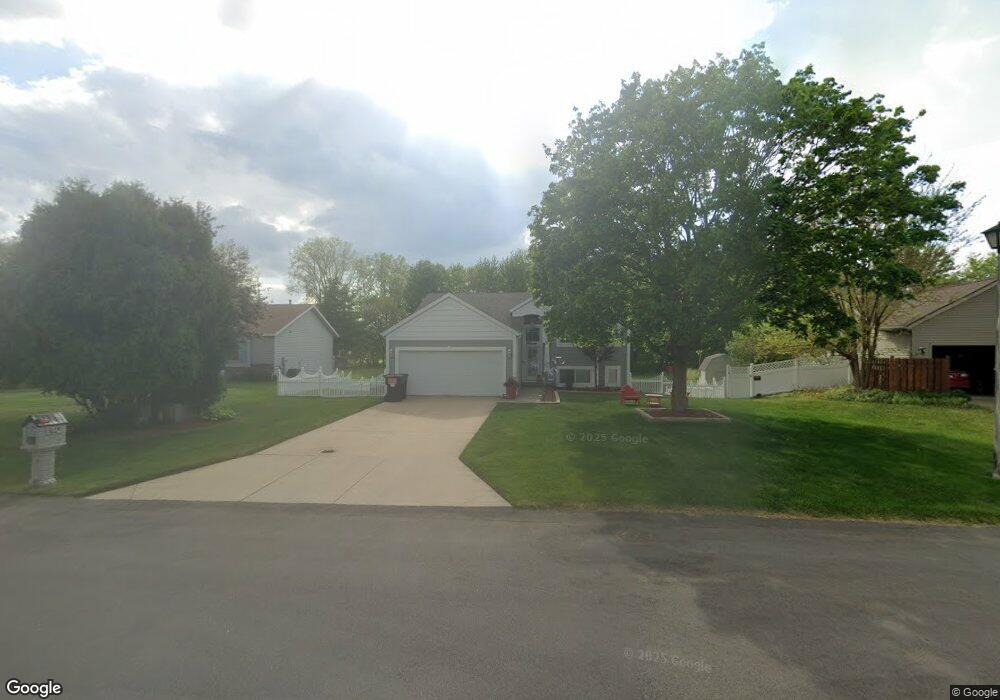
1567 Spencer Ave Hudsonville, MI 49426
Estimated Value: $362,433 - $417,000
4
Beds
2
Baths
1,752
Sq Ft
$218/Sq Ft
Est. Value
About This Home
This home is located at 1567 Spencer Ave, Hudsonville, MI 49426 and is currently estimated at $381,108, approximately $217 per square foot. 1567 Spencer Ave is a home located in Ottawa County with nearby schools including Bursley School, Jenison Junior High School, and Jenison High School.
Ownership History
Date
Name
Owned For
Owner Type
Purchase Details
Closed on
Dec 3, 2015
Sold by
Riggle Steven
Bought by
Riggle Kyndra
Current Estimated Value
Purchase Details
Closed on
Aug 13, 2009
Sold by
Kucera Monique and Kucera Petr
Bought by
Riggle Kyndra and Riggle Steven
Home Financials for this Owner
Home Financials are based on the most recent Mortgage that was taken out on this home.
Original Mortgage
$156,021
Outstanding Balance
$102,089
Interest Rate
5.28%
Mortgage Type
FHA
Estimated Equity
$279,019
Purchase Details
Closed on
May 13, 2003
Sold by
Marlink Builders Inc
Bought by
Salas Petr and Salas Monique
Home Financials for this Owner
Home Financials are based on the most recent Mortgage that was taken out on this home.
Original Mortgage
$151,050
Interest Rate
5.87%
Mortgage Type
Purchase Money Mortgage
Purchase Details
Closed on
Oct 3, 2002
Sold by
Herrington Rebecca
Bought by
Marlink Builders Inc
Create a Home Valuation Report for This Property
The Home Valuation Report is an in-depth analysis detailing your home's value as well as a comparison with similar homes in the area
Home Values in the Area
Average Home Value in this Area
Purchase History
| Date | Buyer | Sale Price | Title Company |
|---|---|---|---|
| Riggle Kyndra | -- | Attorney | |
| Riggle Kyndra | $158,900 | Dba Group Title Agency Svcs | |
| Salas Petr | $159,000 | -- | |
| Marlink Builders Inc | $45,000 | -- |
Source: Public Records
Mortgage History
| Date | Status | Borrower | Loan Amount |
|---|---|---|---|
| Open | Riggle Kyndra | $156,021 | |
| Previous Owner | Salas Petr | $151,050 |
Source: Public Records
Tax History Compared to Growth
Tax History
| Year | Tax Paid | Tax Assessment Tax Assessment Total Assessment is a certain percentage of the fair market value that is determined by local assessors to be the total taxable value of land and additions on the property. | Land | Improvement |
|---|---|---|---|---|
| 2025 | $2,319 | $146,100 | $0 | $0 |
| 2024 | $2,012 | $142,400 | $0 | $0 |
| 2023 | $1,921 | $133,800 | $0 | $0 |
| 2022 | $2,108 | $117,400 | $0 | $0 |
| 2021 | $2,047 | $114,000 | $0 | $0 |
| 2020 | $2,025 | $104,300 | $0 | $0 |
| 2019 | $2,001 | $93,100 | $0 | $0 |
| 2018 | $1,866 | $91,700 | $0 | $0 |
| 2017 | $1,834 | $90,900 | $0 | $0 |
| 2016 | $1,822 | $84,500 | $0 | $0 |
| 2015 | $1,739 | $80,000 | $0 | $0 |
| 2014 | $1,739 | $74,500 | $0 | $0 |
Source: Public Records
Map
Nearby Homes
- 1643 Laramy Ln
- 1496 Eagle Shore Ct Unit 13
- 1519 Eagle Shore Ct Unit Lot 33
- 1481 Eagle Shore Ct Unit 39
- 1451 Eagle Shore Ct
- 1355 Bent Tree Dr Unit 12
- 1433 Winifred St
- 6363 Eastridge Ct
- 1361 Carol Dr
- 6025 Gleneagle Dr
- 1306 Carol Dr
- 6129 W Bay Ct
- 6451 12th Ave
- 1037 Fairfield Dr
- 1241 S Marymark Dr
- 1040 Castlebay Way Unit 19
- 1038 Castlebay Way Unit 18
- 1036 Castlebay Way Unit 17
- Parcel 8 16th Ave
- 1025 Parsons St
- 1571 Spencer Ave
- 1563 Spencer Ave
- 1559 Spencer Ave
- 1575 Spencer Ave
- 1540 Craig Way
- 1537 Craig Way
- 6265 Spencer Ct
- 6271 Spencer Ct
- 1526 Craig Way
- 1537 Sunflower Way
- 1579 Spencer Ave
- 1526 Spencer Ave
- 6281 Spencer Ct
- 1524 Spencer Ave
- 1519 Craig Way
- 1516 Craig Way
- 1521 Sunflower Way
- 1583 Spencer Ave
- 1620 Laramy Ln
- 1620 Laramy Ln Unit 89