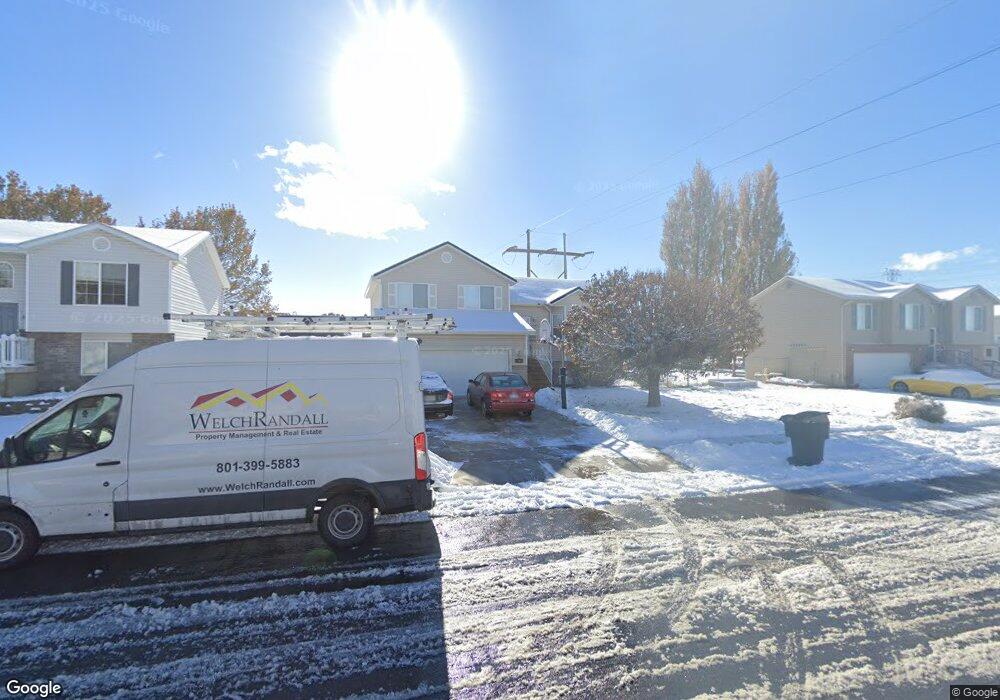
1567 W 1950 N Clearfield, UT 84015
Estimated Value: $465,268 - $493,000
4
Beds
3
Baths
1,950
Sq Ft
$244/Sq Ft
Est. Value
About This Home
This home is located at 1567 W 1950 N, Clearfield, UT 84015 and is currently estimated at $475,567, approximately $243 per square foot. 1567 W 1950 N is a home located in Davis County with nearby schools including Parkside Elementary School, Sunset Junior High School, and Clearfield High School.
Ownership History
Date
Name
Owned For
Owner Type
Purchase Details
Closed on
Dec 17, 2019
Sold by
Macaraeg Si Ierelyn and Macaraeg Franquille
Bought by
Mossberg Carl L and Mossberg Theresa I
Current Estimated Value
Purchase Details
Closed on
Feb 12, 2019
Sold by
Macaraeg Franquille F and Macaraeg Sherelyn B
Bought by
Macaraeg Sherelyn and Mecaraeg Franquille
Home Financials for this Owner
Home Financials are based on the most recent Mortgage that was taken out on this home.
Original Mortgage
$35,000
Interest Rate
4.5%
Mortgage Type
New Conventional
Purchase Details
Closed on
Jun 30, 2009
Sold by
Primacy Closing Corporation
Bought by
Macaraeg Franquille F and Saoit Sherelyn B
Home Financials for this Owner
Home Financials are based on the most recent Mortgage that was taken out on this home.
Original Mortgage
$176,739
Interest Rate
5.59%
Mortgage Type
FHA
Purchase Details
Closed on
Jun 5, 2009
Sold by
Fortkamp Robb J and Fortkamp Nichole M
Bought by
Primacy Closing Corporation
Home Financials for this Owner
Home Financials are based on the most recent Mortgage that was taken out on this home.
Original Mortgage
$176,739
Interest Rate
5.59%
Mortgage Type
FHA
Purchase Details
Closed on
Mar 6, 2002
Sold by
The New Platinum Group Llc and Cherry Brett
Bought by
Fortkamp Robb J and Fortkamp Nichole M
Home Financials for this Owner
Home Financials are based on the most recent Mortgage that was taken out on this home.
Original Mortgage
$131,955
Interest Rate
6.94%
Purchase Details
Closed on
Jun 1, 2001
Sold by
Cherry Brett
Bought by
The New Platinum Group Llc and Cherry Brett
Home Financials for this Owner
Home Financials are based on the most recent Mortgage that was taken out on this home.
Original Mortgage
$125,000
Interest Rate
7.15%
Purchase Details
Closed on
May 31, 2001
Sold by
Northland Properties Llc
Bought by
Cherry Brett
Home Financials for this Owner
Home Financials are based on the most recent Mortgage that was taken out on this home.
Original Mortgage
$125,000
Interest Rate
7.15%
Create a Home Valuation Report for This Property
The Home Valuation Report is an in-depth analysis detailing your home's value as well as a comparison with similar homes in the area
Home Values in the Area
Average Home Value in this Area
Purchase History
| Date | Buyer | Sale Price | Title Company |
|---|---|---|---|
| Mossberg Carl L | -- | Hickman Land Title | |
| Macaraeg Sherelyn | -- | Stewart Title Ins Ag | |
| Macaraeg Franquille F | -- | Home Abst & Title Co | |
| Primacy Closing Corporation | -- | Home Abst & Title Co | |
| Fortkamp Robb J | -- | Security Title | |
| The New Platinum Group Llc | -- | Heritage West Title Insuranc | |
| Cherry Brett | -- | Heritage West Title Insuranc |
Source: Public Records
Mortgage History
| Date | Status | Borrower | Loan Amount |
|---|---|---|---|
| Previous Owner | Macaraeg Sherelyn | $35,000 | |
| Previous Owner | Macaraeg Franquille F | $176,739 | |
| Previous Owner | Primacy Closing Corporation | $176,739 | |
| Previous Owner | Fortkamp Robb J | $131,955 | |
| Previous Owner | The New Platinum Group Llc | $125,000 |
Source: Public Records
Tax History Compared to Growth
Tax History
| Year | Tax Paid | Tax Assessment Tax Assessment Total Assessment is a certain percentage of the fair market value that is determined by local assessors to be the total taxable value of land and additions on the property. | Land | Improvement |
|---|---|---|---|---|
| 2025 | $2,555 | $248,050 | $75,457 | $172,593 |
| 2024 | $2,492 | $240,899 | $83,080 | $157,819 |
| 2023 | $2,264 | $222,750 | $51,856 | $170,893 |
| 2022 | $2,407 | $433,000 | $105,400 | $327,600 |
| 2021 | $2,228 | $327,000 | $72,071 | $254,929 |
| 2020 | $2,017 | $293,000 | $60,975 | $232,025 |
| 2019 | $1,875 | $266,000 | $71,745 | $194,255 |
| 2018 | $1,707 | $238,000 | $60,663 | $177,337 |
| 2016 | $1,474 | $106,095 | $26,502 | $79,593 |
| 2015 | $1,421 | $97,295 | $26,502 | $70,793 |
| 2014 | $1,240 | $86,235 | $26,502 | $59,733 |
| 2013 | -- | $92,008 | $27,143 | $64,865 |
Source: Public Records
Map
Nearby Homes