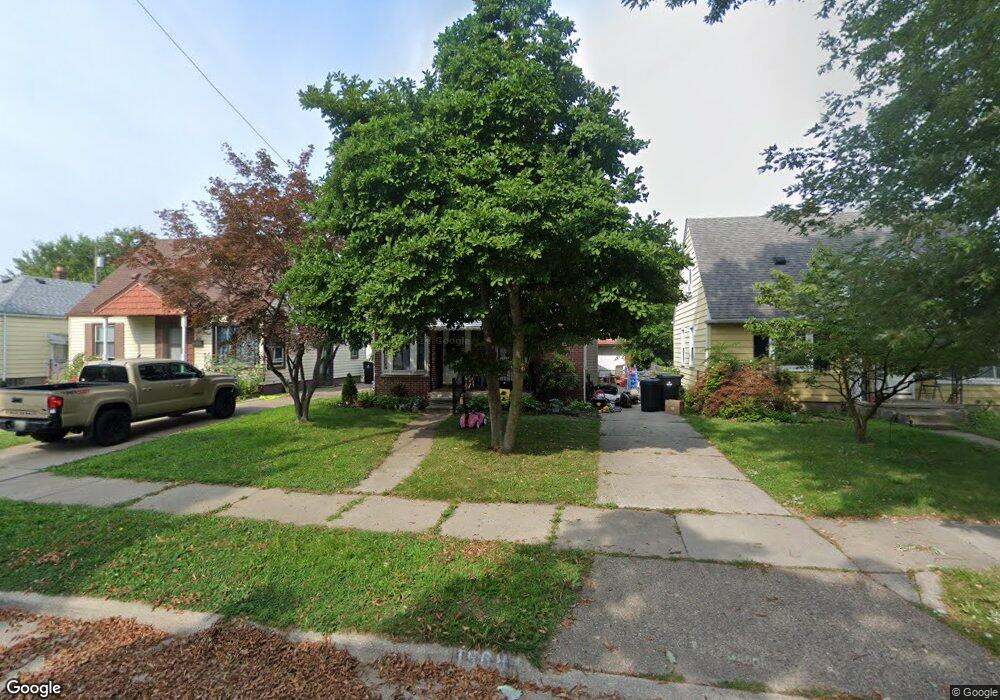
1568 7th St Wyandotte, MI 48192
Estimated Value: $162,000 - $186,000
3
Beds
1
Bath
909
Sq Ft
$189/Sq Ft
Est. Value
About This Home
This home is located at 1568 7th St, Wyandotte, MI 48192 and is currently estimated at $171,630, approximately $188 per square foot. 1568 7th St is a home located in Wayne County with nearby schools including Jefferson Elementary School, Woodrow Wilson School, and Roosevelt High School.
Ownership History
Date
Name
Owned For
Owner Type
Purchase Details
Closed on
May 5, 2022
Sold by
Yost John C
Bought by
Yost John C
Current Estimated Value
Purchase Details
Closed on
Oct 20, 2010
Sold by
Donovan Shaun
Bought by
Yost John C
Purchase Details
Closed on
May 13, 2010
Sold by
Wells Fargo Bank Na
Bought by
The Secretary Of Housing & Urban Develop
Purchase Details
Closed on
Nov 11, 2009
Sold by
Mello Sharee
Bought by
Wells Fargo Bank Na
Purchase Details
Closed on
Mar 18, 2005
Sold by
Saleski Saleski Irene Irene
Bought by
Mello Sharee
Create a Home Valuation Report for This Property
The Home Valuation Report is an in-depth analysis detailing your home's value as well as a comparison with similar homes in the area
Home Values in the Area
Average Home Value in this Area
Purchase History
| Date | Buyer | Sale Price | Title Company |
|---|---|---|---|
| Yost John C | -- | None Listed On Document | |
| Yost John C | $27,900 | None Available | |
| The Secretary Of Housing & Urban Develop | -- | None Available | |
| Wells Fargo Bank Na | $137,603 | None Available | |
| Mello Sharee | $133,000 | Multiple |
Source: Public Records
Tax History Compared to Growth
Tax History
| Year | Tax Paid | Tax Assessment Tax Assessment Total Assessment is a certain percentage of the fair market value that is determined by local assessors to be the total taxable value of land and additions on the property. | Land | Improvement |
|---|---|---|---|---|
| 2025 | $2,161 | $79,100 | $0 | $0 |
| 2024 | $2,161 | $72,400 | $0 | $0 |
| 2023 | $2,060 | $66,100 | $0 | $0 |
| 2022 | $2,648 | $59,000 | $0 | $0 |
| 2021 | $2,587 | $52,900 | $0 | $0 |
| 2020 | $2,551 | $47,500 | $0 | $0 |
| 2019 | $2,513 | $44,000 | $0 | $0 |
| 2018 | $1,812 | $40,900 | $0 | $0 |
| 2017 | $1,258 | $40,900 | $0 | $0 |
| 2016 | $2,415 | $37,200 | $0 | $0 |
| 2015 | $3,252 | $34,500 | $0 | $0 |
| 2013 | $3,150 | $31,500 | $0 | $0 |
| 2012 | $1,819 | $33,000 | $5,200 | $27,800 |
Source: Public Records
Map
Nearby Homes