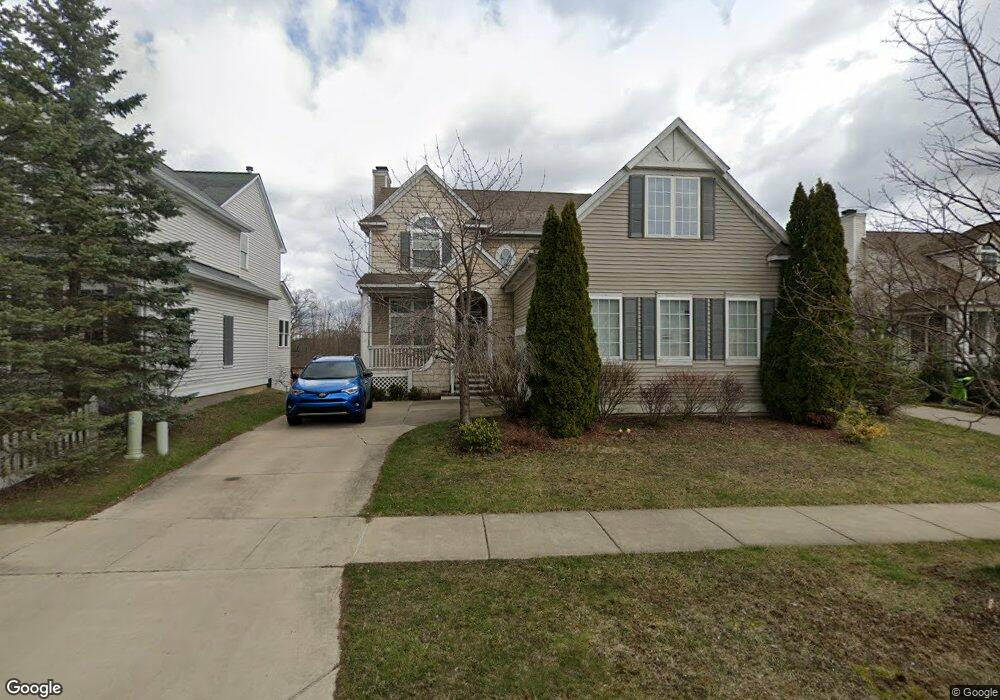
1569 Chapleau Dr Unit 58 Ann Arbor, MI 48103
Estimated Value: $520,000 - $610,000
4
Beds
1
Bath
2,260
Sq Ft
$247/Sq Ft
Est. Value
About This Home
This home is located at 1569 Chapleau Dr Unit 58, Ann Arbor, MI 48103 and is currently estimated at $557,836, approximately $246 per square foot. 1569 Chapleau Dr Unit 58 is a home located in Washtenaw County with nearby schools including Dicken Elementary School, Slauson Middle School, and Pioneer High School.
Ownership History
Date
Name
Owned For
Owner Type
Purchase Details
Closed on
May 18, 2010
Sold by
Mortgage Electronic Registration Systems
Bought by
Lechner Thomas A
Current Estimated Value
Home Financials for this Owner
Home Financials are based on the most recent Mortgage that was taken out on this home.
Original Mortgage
$179,166
Interest Rate
4.77%
Purchase Details
Closed on
Mar 18, 2010
Sold by
Mortgage Electronic Registration Systems
Bought by
Wells Fargo Bank National Association
Purchase Details
Closed on
Jul 30, 2009
Sold by
Scherer John F
Bought by
Mortgage Electronic Registration Systems
Purchase Details
Closed on
Dec 13, 2002
Sold by
Delcor Homes Hometown Village Of Ann Arb
Bought by
Scherer John F
Create a Home Valuation Report for This Property
The Home Valuation Report is an in-depth analysis detailing your home's value as well as a comparison with similar homes in the area
Home Values in the Area
Average Home Value in this Area
Purchase History
| Date | Buyer | Sale Price | Title Company |
|---|---|---|---|
| Lechner Thomas A | $240,000 | Fidelity Land Title Agency | |
| Wells Fargo Bank National Association | -- | None Available | |
| Mortgage Electronic Registration Systems | $205,000 | None Available | |
| Scherer John F | $65,000 | Metropolitan Title Company |
Source: Public Records
Mortgage History
| Date | Status | Borrower | Loan Amount |
|---|---|---|---|
| Previous Owner | Lechner Thomas A | $179,166 |
Source: Public Records
Tax History Compared to Growth
Tax History
| Year | Tax Paid | Tax Assessment Tax Assessment Total Assessment is a certain percentage of the fair market value that is determined by local assessors to be the total taxable value of land and additions on the property. | Land | Improvement |
|---|---|---|---|---|
| 2025 | $4,531 | $240,900 | $0 | $0 |
| 2024 | $4,422 | $230,600 | $0 | $0 |
| 2023 | $4,249 | $206,400 | $0 | $0 |
| 2022 | $5,957 | $209,500 | $0 | $0 |
| 2021 | $5,665 | $207,400 | $0 | $0 |
| 2020 | $5,800 | $193,100 | $0 | $0 |
| 2019 | $5,359 | $180,800 | $180,800 | $0 |
| 2018 | $5,217 | $176,900 | $0 | $0 |
| 2017 | $5,030 | $169,100 | $0 | $0 |
| 2016 | $3,532 | $138,885 | $0 | $0 |
| 2015 | -- | $138,470 | $0 | $0 |
| 2014 | -- | $134,144 | $0 | $0 |
| 2013 | -- | $134,144 | $0 | $0 |
Source: Public Records
Map
Nearby Homes
- 1419 N Bay Dr Unit 73
- 1860 Chicory Ridge
- 1343 Timmins Dr Unit 8
- 1599 Scio Ridge Rd
- 1261 Joyce Ln Unit 4
- 1255 Joyce Ln Unit 1
- 1929 Harley Dr
- 1041 E Summerfield Glen Cir
- 1008 W Summerfield Glen Cir
- 2126 Pauline Blvd Unit 104
- 2124 Pauline Blvd Unit 307
- 1225 S Maple Rd Unit 307
- 922 W Summerfield Glen Cir Unit 110
- 921 E Summerfield Glen Cir Unit 29
- 1235 S Maple Rd Unit 101
- 1235 S Maple Rd Unit 302
- 2120 Pauline Blvd Unit 305
- 1265 S Maple Rd Unit 207
- 2155 Pauline Ct
- 2127 Pauline Ct
- 1561 Chapleau Dr Unit 59
- 1581 Chapleau Dr
- 0 Chapleau Dr
- 1553 Chapleau Dr
- 1572 Chapleau Dr Unit 36
- 1545 Chapleau Dr Unit 61
- 1580 Chapleau Dr Unit 37
- 1556 Chapleau Dr
- 1588 Chapleau Dr
- 1548 Chapleau Dr Unit 33
- 1537 Chapleau Dr Unit 62
- 1540 Chapleau Dr Unit 32
- 1519 Chapleau Dr Unit 63
- 1609 Chapleau Dr
- 1532 Chapleau Dr
- 1511 Chapleau Dr Unit 64
- 1617 Chapleau Dr Unit 55
- 1524 Chapleau Dr Unit 30
- 1612 Chapleau Dr Unit 39
- 1503 Chapleau Dr Unit 65