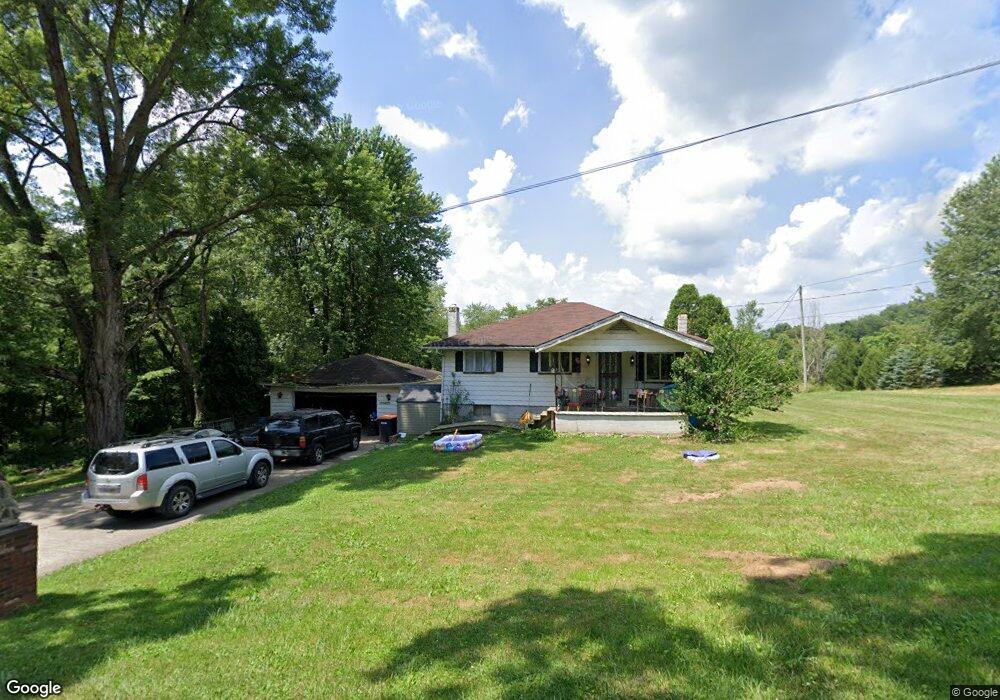
1569 James Rd East Liverpool, OH 43920
Estimated Value: $122,000 - $154,000
3
Beds
2
Baths
1,120
Sq Ft
$123/Sq Ft
Est. Value
About This Home
This home is located at 1569 James Rd, East Liverpool, OH 43920 and is currently estimated at $137,715, approximately $122 per square foot. 1569 James Rd is a home with nearby schools including Westgate Middle School, LaCroft Elementary School, and East Liverpool High School.
Ownership History
Date
Name
Owned For
Owner Type
Purchase Details
Closed on
Jun 24, 2016
Bought by
Denny Koster
Current Estimated Value
Home Financials for this Owner
Home Financials are based on the most recent Mortgage that was taken out on this home.
Interest Rate
3.56%
Purchase Details
Closed on
Apr 28, 2016
Bought by
Julie L Woolley and Woolley
Home Financials for this Owner
Home Financials are based on the most recent Mortgage that was taken out on this home.
Interest Rate
3.56%
Create a Home Valuation Report for This Property
The Home Valuation Report is an in-depth analysis detailing your home's value as well as a comparison with similar homes in the area
Home Values in the Area
Average Home Value in this Area
Purchase History
| Date | Buyer | Sale Price | Title Company |
|---|---|---|---|
| Denny Koster | $34,350 | -- | |
| Julie L Woolley | -- | -- |
Source: Public Records
Mortgage History
| Date | Status | Borrower | Loan Amount |
|---|---|---|---|
| Closed | Denny Koster | -- | |
| Previous Owner | Denny Koster | -- |
Source: Public Records
Tax History Compared to Growth
Tax History
| Year | Tax Paid | Tax Assessment Tax Assessment Total Assessment is a certain percentage of the fair market value that is determined by local assessors to be the total taxable value of land and additions on the property. | Land | Improvement |
|---|---|---|---|---|
| 2024 | $1,249 | $29,900 | $4,100 | $25,800 |
| 2023 | $1,250 | $29,900 | $4,100 | $25,800 |
| 2022 | $1,250 | $29,900 | $4,100 | $25,800 |
| 2021 | $1,083 | $24,710 | $4,480 | $20,230 |
| 2020 | $1,085 | $24,710 | $4,480 | $20,230 |
| 2019 | $1,084 | $24,710 | $4,480 | $20,230 |
| 2018 | $1,048 | $22,440 | $4,060 | $18,380 |
| 2017 | $1,105 | $22,440 | $4,060 | $18,380 |
| 2016 | $782 | $24,050 | $3,960 | $20,090 |
| 2015 | $745 | $24,050 | $3,960 | $20,090 |
| 2014 | $688 | $24,050 | $3,960 | $20,090 |
Source: Public Records
Map
Nearby Homes