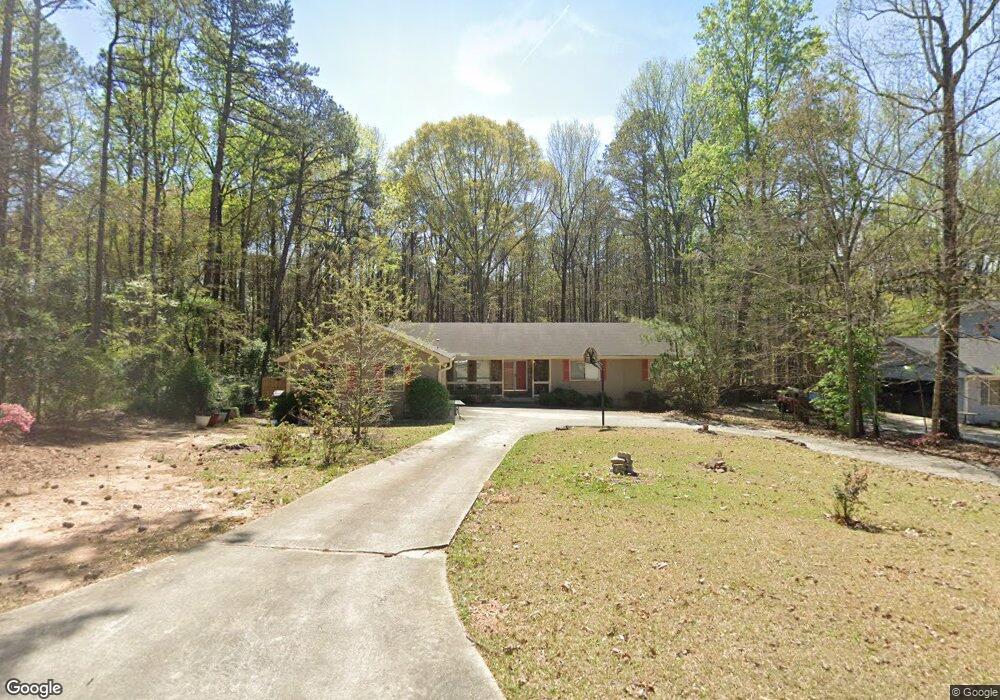
1569 Kon Tiki Ln Unit 3 Jonesboro, GA 30236
Estimated Value: $252,075 - $303,000
3
Beds
2
Baths
1,869
Sq Ft
$145/Sq Ft
Est. Value
About This Home
This home is located at 1569 Kon Tiki Ln Unit 3, Jonesboro, GA 30236 and is currently estimated at $271,769, approximately $145 per square foot. 1569 Kon Tiki Ln Unit 3 is a home located in Clayton County with nearby schools including James Jackson Elementary School, Jonesboro Middle School, and Jonesboro High School.
Ownership History
Date
Name
Owned For
Owner Type
Purchase Details
Closed on
May 24, 2022
Sold by
Grays Matthew C
Bought by
Matthew C Grays & Associates Llc
Current Estimated Value
Purchase Details
Closed on
Jan 15, 1999
Sold by
Sharp Andrea and Sharp Michael W
Bought by
Grays Matthew
Home Financials for this Owner
Home Financials are based on the most recent Mortgage that was taken out on this home.
Original Mortgage
$102,147
Interest Rate
6.71%
Mortgage Type
FHA
Purchase Details
Closed on
Aug 23, 1993
Sold by
Dipietro Anthony F Deborah
Bought by
Sharp Andrea M
Home Financials for this Owner
Home Financials are based on the most recent Mortgage that was taken out on this home.
Original Mortgage
$96,187
Interest Rate
7.5%
Mortgage Type
VA
Create a Home Valuation Report for This Property
The Home Valuation Report is an in-depth analysis detailing your home's value as well as a comparison with similar homes in the area
Home Values in the Area
Average Home Value in this Area
Purchase History
| Date | Buyer | Sale Price | Title Company |
|---|---|---|---|
| Matthew C Grays & Associates Llc | -- | -- | |
| Grays Matthew | $103,000 | -- | |
| Sharp Andrea M | $95,000 | -- |
Source: Public Records
Mortgage History
| Date | Status | Borrower | Loan Amount |
|---|---|---|---|
| Previous Owner | Grays Matthew | $102,147 | |
| Previous Owner | Sharp Andrea M | $96,187 |
Source: Public Records
Tax History Compared to Growth
Tax History
| Year | Tax Paid | Tax Assessment Tax Assessment Total Assessment is a certain percentage of the fair market value that is determined by local assessors to be the total taxable value of land and additions on the property. | Land | Improvement |
|---|---|---|---|---|
| 2024 | $4,404 | $112,880 | $8,800 | $104,080 |
| 2023 | $4,285 | $114,360 | $8,800 | $105,560 |
| 2022 | $3,287 | $83,760 | $8,800 | $74,960 |
| 2021 | $2,787 | $70,560 | $8,800 | $61,760 |
| 2020 | $2,360 | $59,010 | $8,800 | $50,210 |
| 2019 | $2,035 | $50,121 | $7,400 | $42,721 |
| 2018 | $2,035 | $50,118 | $7,400 | $42,718 |
| 2017 | $1,880 | $46,194 | $7,400 | $38,794 |
| 2016 | $1,900 | $46,698 | $7,400 | $39,298 |
| 2015 | $1,678 | $0 | $0 | $0 |
| 2014 | $1,607 | $40,412 | $7,400 | $33,012 |
Source: Public Records
Map
Nearby Homes
- 8033 Aloha Dr
- 1699 Brenda Dr Unit 2
- 1608 Bogota Way
- 1732 Winding Woods Ln
- 8039 Woods Ln
- 1904 Cades Cove
- 7972 Woods Ln Unit IX
- 139 Cecelia Cir
- 8356 Carlington Ln
- 121 Raymond St
- 1963 Amber Leaf Ct
- 8391 Carlington Ln
- 8347 Hilltop Rd
- 8399 Carlington Ln
- 1198 Spur 138
- 2 Woodhaven Dr
- 7621 Raleigh Ln
- 8430 Carlington Ln
- 1879 Wrights Way
- 126 Irvin St
- 1563 Kon Tiki Ln Unit 3
- 1585 Kon Tiki Ln
- 0 Kon-Tiki Ln Unit 7437079
- 0 Kon-Tiki Ln Unit 3267383
- 0 Kon-Tiki Ln Unit 8758778
- 0 Kon-Tiki Ln Unit 8215369
- 0 Kon-Tiki Ln Unit 8010314
- 0 Kon-Tiki Ln Unit 7045588
- 0 Kon-Tiki Ln
- 1572 Kon Tiki Ln
- 1564 Kon Tiki Ln
- 1580 Kon Tiki Ln Unit 3
- 1547 Kon Tiki Ln Unit 3
- 1556 Kon Tiki Ln Unit 3
- 7997 Aloha Dr Unit 2
- 1588 Kon Tiki Ln
- 7981 Aloha Dr Unit 2
- 7983 Cardinal Cove
- 8009 Aloha Dr
- 1548 Kon Tiki Ln