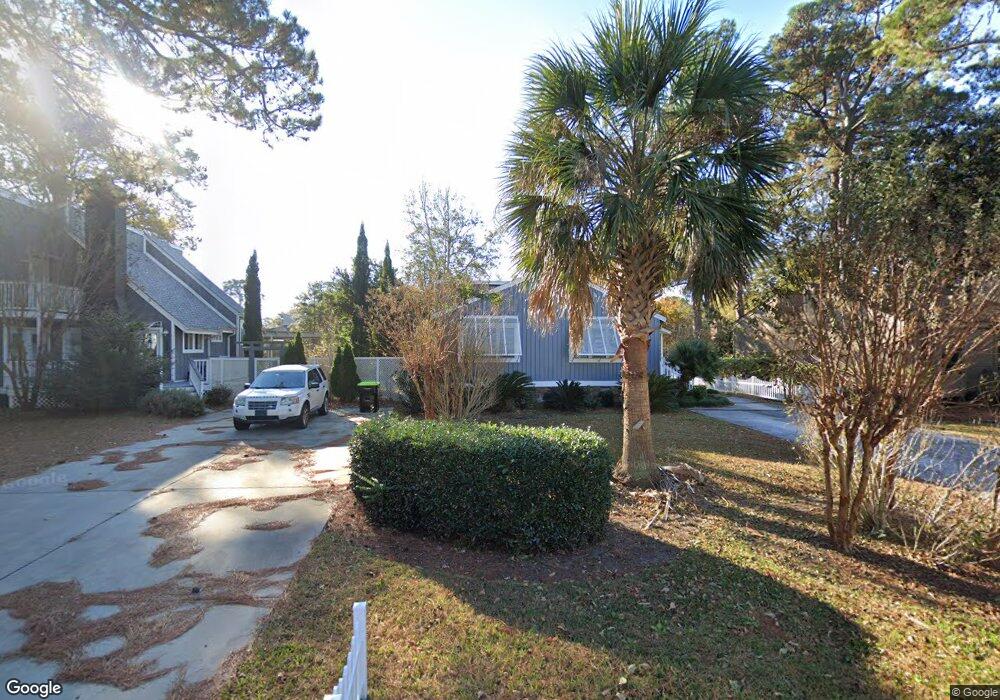
1569 Landing Rd Myrtle Beach, SC 29577
Myrtlewood NeighborhoodEstimated Value: $260,889 - $335,000
2
Beds
2
Baths
1,408
Sq Ft
$214/Sq Ft
Est. Value
About This Home
This home is located at 1569 Landing Rd, Myrtle Beach, SC 29577 and is currently estimated at $301,222, approximately $213 per square foot. 1569 Landing Rd is a home located in Horry County with nearby schools including Myrtle Beach Child Development Center, Myrtle Beach Elementary School, and Myrtle Beach Primary School.
Ownership History
Date
Name
Owned For
Owner Type
Purchase Details
Closed on
Aug 4, 2025
Sold by
Stewart Timothy Vanepps
Bought by
Thompson Tiffany L and Stewart Timothy Vanepps
Current Estimated Value
Purchase Details
Closed on
Apr 10, 2025
Sold by
Vanepps Susan Fellows
Bought by
Stewart Timothy Vanepps and Thompson Tiffany L
Purchase Details
Closed on
Sep 14, 2009
Sold by
Vanepps Susan F
Bought by
Stewart Timothy Van Epps
Purchase Details
Closed on
Jun 19, 2006
Sold by
Lane Otho C and Lane Mary E
Bought by
Vanepps Susan F
Home Financials for this Owner
Home Financials are based on the most recent Mortgage that was taken out on this home.
Original Mortgage
$195,300
Interest Rate
6.5%
Mortgage Type
Purchase Money Mortgage
Purchase Details
Closed on
Jan 30, 2003
Sold by
Owens Jean J
Bought by
Lane Otho C and Lane Mary E
Home Financials for this Owner
Home Financials are based on the most recent Mortgage that was taken out on this home.
Original Mortgage
$129,800
Interest Rate
5.89%
Mortgage Type
Purchase Money Mortgage
Create a Home Valuation Report for This Property
The Home Valuation Report is an in-depth analysis detailing your home's value as well as a comparison with similar homes in the area
Home Values in the Area
Average Home Value in this Area
Purchase History
| Date | Buyer | Sale Price | Title Company |
|---|---|---|---|
| Thompson Tiffany L | -- | -- | |
| Stewart Timothy Vanepps | -- | -- | |
| Stewart Timothy Van Epps | -- | -- | |
| Vanepps Susan F | $217,000 | None Available | |
| Lane Otho C | $137,300 | -- |
Source: Public Records
Mortgage History
| Date | Status | Borrower | Loan Amount |
|---|---|---|---|
| Previous Owner | Vanepps Susan F | $195,300 | |
| Previous Owner | Lane Otho C | $129,800 |
Source: Public Records
Tax History Compared to Growth
Tax History
| Year | Tax Paid | Tax Assessment Tax Assessment Total Assessment is a certain percentage of the fair market value that is determined by local assessors to be the total taxable value of land and additions on the property. | Land | Improvement |
|---|---|---|---|---|
| 2024 | $2,427 | $15,017 | $7,908 | $7,109 |
| 2023 | $2,427 | $10,109 | $3,971 | $6,138 |
| 2021 | $2,240 | $10,109 | $3,971 | $6,138 |
| 2020 | $2,118 | $10,109 | $3,971 | $6,138 |
| 2019 | $2,118 | $10,109 | $3,971 | $6,138 |
| 2018 | $0 | $9,266 | $3,938 | $5,328 |
| 2017 | $2,001 | $9,266 | $3,938 | $5,328 |
| 2016 | -- | $9,266 | $3,938 | $5,328 |
| 2015 | $583 | $9,266 | $3,938 | $5,328 |
| 2014 | $539 | $9,266 | $3,938 | $5,328 |
Source: Public Records
Map
Nearby Homes
- 3533 Lighthouse Way
- 1587 Landing Rd
- 1662 Landing Rd
- 1563 Elizabeth Rd
- 3015 Old Bryan Dr Unit 7-3
- 3015 Old Bryan Dr Unit 12-2
- 3015 Old Bryan Dr Unit 13-6
- 3015 Old Bryan Dr Unit 12-4
- 3015 Old Bryan Dr Unit 4-8
- 3015 Old Bryan Dr Unit 15-5
- 3015 Old Bryan Dr Unit Shorewood 15-6
- 3015 Old Bryan Dr Unit 17-3 SHOREWOOD
- 3015 Old Bryan Dr Unit 4
- 3015 Old Bryan Dr Unit 16-5
- 3814 Palmetto Dr
- 3754 Annandale Dr
- 3758 Annandale Dr
- 3749 Annandale Dr
- 3837 Myrtle Pointe Dr Unit 3837
- 4108 Fairway Lakes Dr Unit 4108
- 1563 Landing Rd
- 1563 Landing Rd Unit PLANTATION POINT
- 1575 Landing Rd
- 1562 Landing Rd
- 3527 Lighthouse Way Unit MB
- 1581 Landing Rd
- 1553 Landing Rd
- 3521 Lighthouse Way
- 3521 Lighthouse Way Unit THE LANDING @ PLANTA
- 1572 Landing Rd
- 1545 Landing Rd
- 1566 Landing Rd
- 1587 Landing Rd Unit The Landing at Plant
- 1578 Landing Rd
- 1560 Landing Rd
- 3515 Lighthouse Way
- 3541 Lighthouse Way
- 1584 Landing Rd Unit 1584 Landing Road
- 1584 Landing Rd
- 1539 Landing Rd