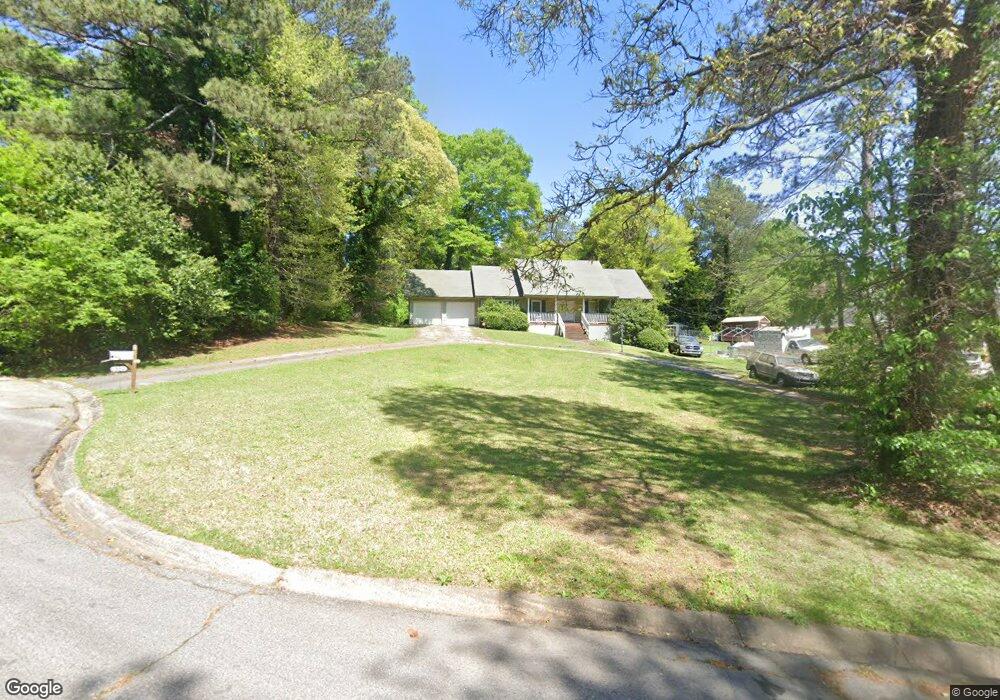
1569 Olivet Ct Riverdale, GA 30296
Estimated Value: $249,668 - $324,000
4
Beds
3
Baths
1,944
Sq Ft
$145/Sq Ft
Est. Value
About This Home
This home is located at 1569 Olivet Ct, Riverdale, GA 30296 and is currently estimated at $281,667, approximately $144 per square foot. 1569 Olivet Ct is a home located in Clayton County with nearby schools including Oliver Elementary School, Riverdale Middle School, and North Clayton High School.
Ownership History
Date
Name
Owned For
Owner Type
Purchase Details
Closed on
Mar 18, 2010
Sold by
Hud-Housing Of Urban Dev
Bought by
Norris Richard A
Current Estimated Value
Home Financials for this Owner
Home Financials are based on the most recent Mortgage that was taken out on this home.
Original Mortgage
$81,275
Outstanding Balance
$54,831
Interest Rate
5.5%
Mortgage Type
FHA
Estimated Equity
$226,836
Purchase Details
Closed on
Jan 7, 2005
Sold by
Borum Ella
Bought by
Chase Manhattan Mtg
Purchase Details
Closed on
Jan 7, 2003
Sold by
Chase Home Finance Llc
Bought by
Hud-Housing Of Urban Dev
Purchase Details
Closed on
Apr 15, 2002
Sold by
Borum Willie
Bought by
Borum Carol
Purchase Details
Closed on
Mar 15, 1999
Sold by
Borum Ella
Bought by
Borum Willie
Purchase Details
Closed on
Dec 3, 1995
Sold by
Dees Barbara H
Bought by
Borum Ella
Create a Home Valuation Report for This Property
The Home Valuation Report is an in-depth analysis detailing your home's value as well as a comparison with similar homes in the area
Home Values in the Area
Average Home Value in this Area
Purchase History
| Date | Buyer | Sale Price | Title Company |
|---|---|---|---|
| Norris Richard A | -- | -- | |
| Chase Manhattan Mtg | $156,789 | -- | |
| Hud-Housing Of Urban Dev | -- | -- | |
| Borum Carol | -- | -- | |
| Borum Willie | -- | -- | |
| Borum Ella | $28,000 | -- |
Source: Public Records
Mortgage History
| Date | Status | Borrower | Loan Amount |
|---|---|---|---|
| Open | Norris Richard A | $81,275 |
Source: Public Records
Tax History Compared to Growth
Tax History
| Year | Tax Paid | Tax Assessment Tax Assessment Total Assessment is a certain percentage of the fair market value that is determined by local assessors to be the total taxable value of land and additions on the property. | Land | Improvement |
|---|---|---|---|---|
| 2025 | $2,957 | $86,240 | $8,000 | $78,240 |
| 2024 | $3,108 | $88,720 | $8,000 | $80,720 |
| 2023 | $2,903 | $80,400 | $8,000 | $72,400 |
| 2022 | $2,100 | $62,560 | $8,000 | $54,560 |
| 2021 | $1,753 | $53,440 | $8,000 | $45,440 |
| 2020 | $1,649 | $50,318 | $8,000 | $42,318 |
| 2019 | $1,518 | $46,486 | $6,400 | $40,086 |
| 2018 | $1,611 | $48,784 | $6,400 | $42,384 |
| 2017 | $1,073 | $35,472 | $6,400 | $29,072 |
| 2016 | $917 | $31,631 | $6,400 | $25,231 |
| 2015 | $916 | $0 | $0 | $0 |
| 2014 | $735 | $27,544 | $8,000 | $19,544 |
Source: Public Records
Map
Nearby Homes
- 1584 Hebron Ln
- 1516 Chase Ct
- 6952 W Fayetteville Rd
- 1505 Diplomat Dr
- 6940 W Fayetteville Rd
- 1467 Diplomat Dr
- 1445 Diplomat Dr
- 1382 Koble Mill Ln
- 1553 Sultan Ln
- 1357 Bethaven Rd
- 1341 Bethaven Rd
- 6712 Collier Way
- 1418 Winchester Trail
- 6678 Collier Way Unit 2
- 6897 Shangrila Way
- 1901 Cherwell Dr
- 6807 Shangrila Way Unit 5
- 1292 Partridge Ln
- 1267 Partridge Ln
- 7438 Ambassador Dr
- TEST Test 9 Rd
- 0 Test Unit 10012469
- 1557 Olivet Ct
- 1577 Olivet Ct
- 8190 Tiger Way Unit (LOT 87)
- 8190 Tiger Way
- 1556 Fair Haven Dr Unit 3
- 7025 Dalmatia Dr
- 7037 Dalmatia Dr
- 1570 Fair Haven Dr Unit 3
- 1572 Olivet Ct
- 1562 Olivet Ct
- 7053 Dalmatia Dr Unit 4
- 1582 Fair Haven Dr
- 1530 Fair Haven Dr
- 1554 Olivet Ct
- 1580 Olivet Ct Unit 4
- 1546 Olivet Ct Unit 4
- 1594 Fair Haven Dr
- 1532 Olivet Ct