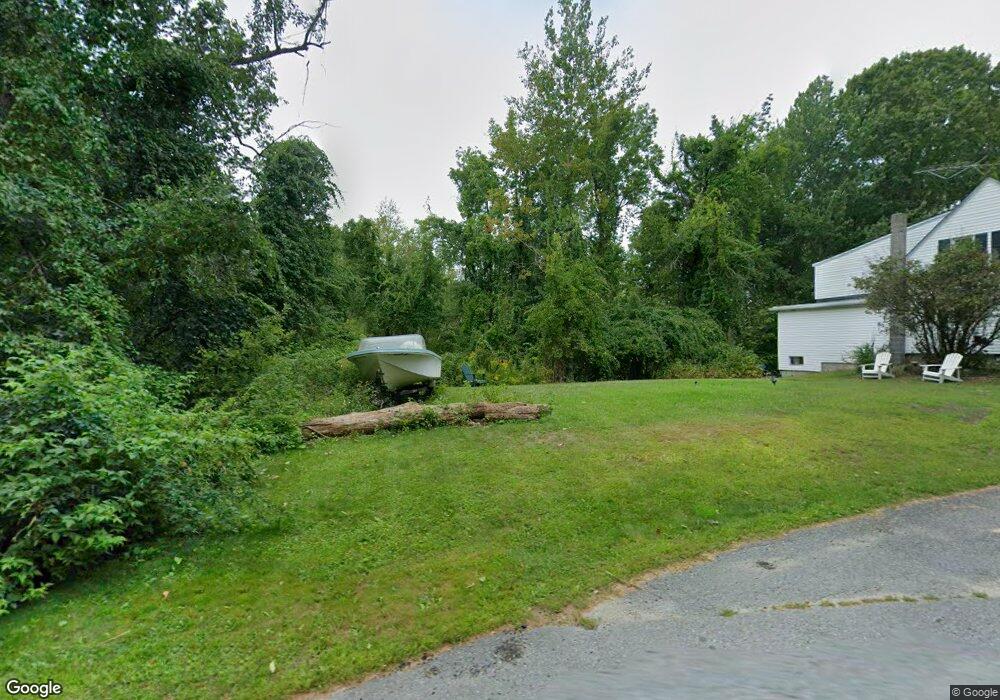
157 Ashby Rd Ashburnham, MA 01430
Estimated Value: $445,000 - $601,000
2
Beds
2
Baths
560
Sq Ft
$951/Sq Ft
Est. Value
About This Home
This home is located at 157 Ashby Rd, Ashburnham, MA 01430 and is currently estimated at $532,424, approximately $950 per square foot. 157 Ashby Rd is a home located in Worcester County with nearby schools including Oakmont Regional High School and Cushing Academy.
Ownership History
Date
Name
Owned For
Owner Type
Purchase Details
Closed on
Oct 24, 2018
Sold by
Damon David P
Bought by
Traffie Lars and Traffie Angela M
Current Estimated Value
Home Financials for this Owner
Home Financials are based on the most recent Mortgage that was taken out on this home.
Original Mortgage
$125,000
Outstanding Balance
$75,854
Interest Rate
4%
Mortgage Type
New Conventional
Estimated Equity
$456,570
Purchase Details
Closed on
Sep 7, 1979
Bought by
Damon David P
Create a Home Valuation Report for This Property
The Home Valuation Report is an in-depth analysis detailing your home's value as well as a comparison with similar homes in the area
Home Values in the Area
Average Home Value in this Area
Purchase History
| Date | Buyer | Sale Price | Title Company |
|---|---|---|---|
| Traffie Lars | $325,000 | -- | |
| Traffie Lars | $325,000 | -- | |
| Traffie Lars | $325,000 | -- | |
| Damon David P | -- | -- |
Source: Public Records
Mortgage History
| Date | Status | Borrower | Loan Amount |
|---|---|---|---|
| Open | Traffie Lars | $125,000 | |
| Closed | Traffie Lars | $125,000 |
Source: Public Records
Tax History
| Year | Tax Paid | Tax Assessment Tax Assessment Total Assessment is a certain percentage of the fair market value that is determined by local assessors to be the total taxable value of land and additions on the property. | Land | Improvement |
|---|---|---|---|---|
| 2025 | $6,787 | $456,400 | $203,400 | $253,000 |
| 2024 | $5,728 | $363,700 | $202,900 | $160,800 |
| 2023 | $5,923 | $357,900 | $202,900 | $155,000 |
| 2022 | $5,249 | $278,000 | $164,900 | $113,100 |
| 2021 | $5,413 | $263,400 | $164,900 | $98,500 |
| 2020 | $5,294 | $263,400 | $164,900 | $98,500 |
| 2019 | $5,038 | $223,400 | $149,500 | $73,900 |
| 2018 | $4,984 | $213,000 | $142,100 | $70,900 |
| 2017 | $4,084 | $177,800 | $112,700 | $65,100 |
| 2016 | $3,995 | $175,600 | $111,000 | $64,600 |
| 2015 | $3,912 | $175,600 | $111,000 | $64,600 |
Source: Public Records
Map
Nearby Homes
Your Personal Tour Guide
Ask me questions while you tour the home.