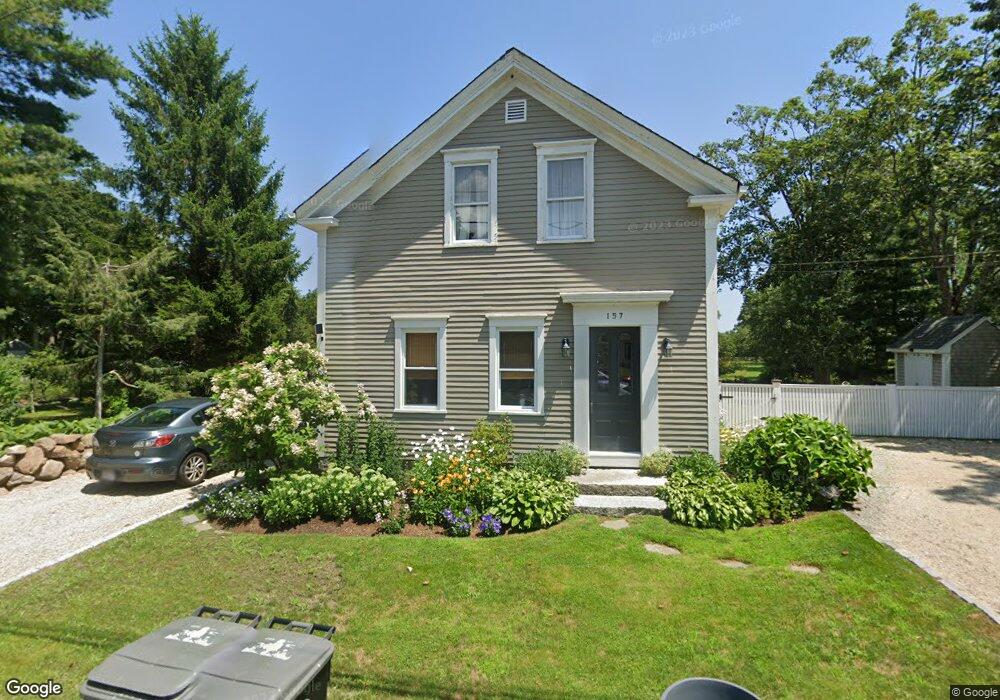
157 Bakerville Rd South Dartmouth, MA 02748
Cow Yard/Nonquitt NeighborhoodEstimated Value: $424,000 - $614,000
3
Beds
2
Baths
1,277
Sq Ft
$419/Sq Ft
Est. Value
About This Home
This home is located at 157 Bakerville Rd, South Dartmouth, MA 02748 and is currently estimated at $535,658, approximately $419 per square foot. 157 Bakerville Rd is a home located in Bristol County with nearby schools including Dartmouth High School.
Ownership History
Date
Name
Owned For
Owner Type
Purchase Details
Closed on
Jan 16, 2009
Sold by
French Elizabeth K
Bought by
French Christopher S and French Elizabeth K
Current Estimated Value
Home Financials for this Owner
Home Financials are based on the most recent Mortgage that was taken out on this home.
Original Mortgage
$252,000
Outstanding Balance
$162,155
Interest Rate
5.52%
Mortgage Type
Purchase Money Mortgage
Estimated Equity
$373,503
Purchase Details
Closed on
Apr 21, 2006
Sold by
French Christopher S and Kemper Elizabeth A
Bought by
French Elizabeth K
Purchase Details
Closed on
Aug 18, 1999
Sold by
Bakerville Rt
Bought by
Kemper Elizabeth A and French Christopher S
Purchase Details
Closed on
Nov 6, 1998
Sold by
Department Of Housing & Urban Dev
Bought by
Bakerville Rt
Purchase Details
Closed on
Apr 29, 1998
Sold by
Thibodeau Scott D
Bought by
Fleet Mtg Corp
Create a Home Valuation Report for This Property
The Home Valuation Report is an in-depth analysis detailing your home's value as well as a comparison with similar homes in the area
Home Values in the Area
Average Home Value in this Area
Purchase History
| Date | Buyer | Sale Price | Title Company |
|---|---|---|---|
| French Christopher S | -- | -- | |
| French Elizabeth K | -- | -- | |
| Kemper Elizabeth A | $193,000 | -- | |
| Bakerville Rt | $60,000 | -- | |
| Fleet Mtg Corp | $106,348 | -- |
Source: Public Records
Mortgage History
| Date | Status | Borrower | Loan Amount |
|---|---|---|---|
| Open | Fleet Mtg Corp | $252,000 | |
| Previous Owner | Fleet Mtg Corp | $240,000 |
Source: Public Records
Tax History Compared to Growth
Tax History
| Year | Tax Paid | Tax Assessment Tax Assessment Total Assessment is a certain percentage of the fair market value that is determined by local assessors to be the total taxable value of land and additions on the property. | Land | Improvement |
|---|---|---|---|---|
| 2025 | $3,236 | $375,900 | $150,000 | $225,900 |
| 2024 | $3,088 | $355,300 | $150,000 | $205,300 |
| 2023 | $3,004 | $327,600 | $138,200 | $189,400 |
| 2022 | $2,916 | $294,500 | $138,200 | $156,300 |
| 2021 | $4,715 | $283,900 | $122,700 | $161,200 |
| 2020 | $2,931 | $282,400 | $128,400 | $154,000 |
| 2019 | $4,061 | $264,400 | $119,300 | $145,100 |
| 2018 | $3,281 | $256,500 | $119,300 | $137,200 |
| 2017 | $2,564 | $255,900 | $116,800 | $139,100 |
| 2016 | $2,554 | $251,400 | $127,700 | $123,700 |
| 2015 | $2,418 | $238,500 | $113,200 | $125,300 |
| 2014 | $2,374 | $232,500 | $110,000 | $122,500 |
Source: Public Records
Map
Nearby Homes
- 248 Bakerville Rd
- 61 Pardon Hill Rd
- 105 Rock Odundee Rd
- 24 White Alder Way
- 738 Smith Neck Rd
- 1150 Russells Mills Rd
- Lot 1 Rafael Rd
- 34 Country Way
- 75 Country Way Unit 75
- 482 Smith Neck Rd
- 360 Russells Mills Rd
- 76 Shipyard Ln
- 48 Wilson St
- 3 Mishawum Dr
- 5 Samosett Dr
- 21 Avis St
- 40 School St
- Lot 2E Horseneck Rd
- 23 High St
- 212 Rockland St
- 151 Bakerville Rd
- 156 Bakerville Rd
- 147 Bakerville Rd
- 152 Bakerville Rd
- 172 Bakerville Rd
- 143 Bakerville Rd
- 176 Bakerville Rd
- 134 Bakerville Rd
- 4 Bakers Brook Rd
- 190 Bakerville Rd
- 114 Bakerville Rd
- 117 Bakerville Rd
- 0 Bakerbrook Rd Unit 71721407
- 0 Bakerbrook Rd Unit 71931385
- 0 Bakerbrook Rd Unit 72605347
- 8 Bakers Brook Rd
- 205 Bakerville Rd
- 107 Bakerville Rd
- 108 Bakerville Rd
- 200 Bakerville Rd