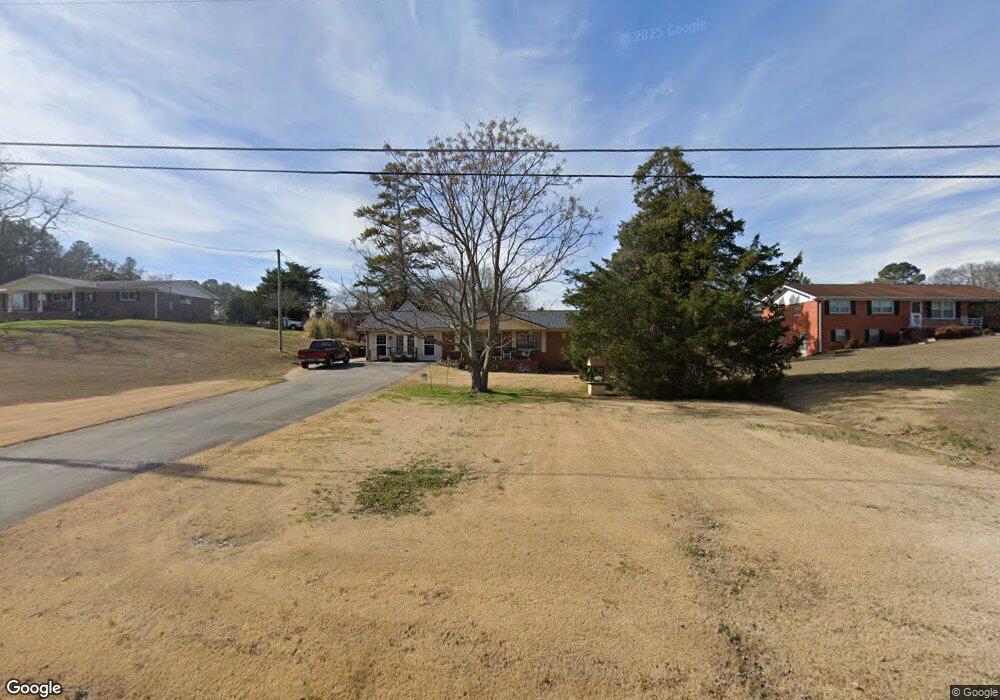
157 Beamer Cir SW Calhoun, GA 30701
Estimated Value: $230,000 - $276,793
3
Beds
2
Baths
1,856
Sq Ft
$139/Sq Ft
Est. Value
About This Home
This home is located at 157 Beamer Cir SW, Calhoun, GA 30701 and is currently estimated at $257,948, approximately $138 per square foot. 157 Beamer Cir SW is a home located in Gordon County with nearby schools including Swain Elementary School, Ashworth Middle School, and Gordon Central High School.
Ownership History
Date
Name
Owned For
Owner Type
Purchase Details
Closed on
Jun 3, 2010
Sold by
Secretary Of Housing & Urban Development
Bought by
Poole Karen D
Current Estimated Value
Home Financials for this Owner
Home Financials are based on the most recent Mortgage that was taken out on this home.
Original Mortgage
$98,569
Outstanding Balance
$67,755
Interest Rate
5.5%
Mortgage Type
FHA
Estimated Equity
$190,193
Purchase Details
Closed on
Dec 1, 2009
Sold by
Midfirst Bank
Bought by
Secretary Of Housing & Urban Development
Purchase Details
Closed on
Jan 29, 2007
Sold by
Sexton Doug
Bought by
Jackson Ollie Mae
Purchase Details
Closed on
Jul 18, 2006
Sold by
Sexton Doug
Bought by
Sexton Doug and Sexton Lisa
Purchase Details
Closed on
May 2, 2006
Sold by
Russell Traci
Bought by
Federal National Mtg Associati
Purchase Details
Closed on
Dec 21, 1987
Bought by
Russell Harry Wade and Russell Traci D
Create a Home Valuation Report for This Property
The Home Valuation Report is an in-depth analysis detailing your home's value as well as a comparison with similar homes in the area
Home Values in the Area
Average Home Value in this Area
Purchase History
| Date | Buyer | Sale Price | Title Company |
|---|---|---|---|
| Poole Karen D | $95,000 | -- | |
| Secretary Of Housing & Urban Development | $131,600 | -- | |
| Midfirst Bank | $131,563 | -- | |
| Jackson Ollie Mae | $116,701 | -- | |
| Sexton Doug | $73,000 | -- | |
| Sexton Doug | $73,000 | -- | |
| Federal National Mtg Associati | $83,232 | -- | |
| Russell Harry Wade | -- | -- |
Source: Public Records
Mortgage History
| Date | Status | Borrower | Loan Amount |
|---|---|---|---|
| Open | Poole Karen D | $98,569 |
Source: Public Records
Tax History Compared to Growth
Tax History
| Year | Tax Paid | Tax Assessment Tax Assessment Total Assessment is a certain percentage of the fair market value that is determined by local assessors to be the total taxable value of land and additions on the property. | Land | Improvement |
|---|---|---|---|---|
| 2024 | $1,596 | $64,836 | $3,360 | $61,476 |
| 2023 | $1,491 | $60,676 | $3,360 | $57,316 |
| 2022 | $1,480 | $56,796 | $3,360 | $53,436 |
| 2021 | $1,229 | $45,876 | $3,360 | $42,516 |
| 2020 | $1,244 | $45,436 | $3,360 | $42,076 |
| 2019 | $1,251 | $45,436 | $3,360 | $42,076 |
| 2018 | $1,160 | $42,276 | $3,360 | $38,916 |
| 2017 | $1,127 | $40,036 | $3,360 | $36,676 |
| 2016 | $1,130 | $40,036 | $3,360 | $36,676 |
| 2015 | $1,118 | $39,276 | $3,360 | $35,916 |
| 2014 | $1,062 | $38,485 | $3,360 | $35,125 |
Source: Public Records
Map
Nearby Homes
- 413 Beamer Rd SW
- 130 Brookstone Dr SW
- 176 Village Way SW
- 137 Regency Row SW
- The Braselton II Plan at Fair Oak
- The Reynolds Plan at Fair Oak
- The Buford II Plan at Fair Oak
- The Lawson Plan at Fair Oak
- The Caldwell Plan at Fair Oak
- The Benson II Plan at Fair Oak
- The Greenbrier II Plan at Fair Oak
- 210 Madison Dr SW
- 121 Foxhall Dr SW
- 215 Wilson St
- 0 Highway 53 Spur SW Unit 7529096
- 227 Mcconnell Rd
- 100 Neal St
- 404 Mcginnis Cir
- 153 Riverview Dr
- 85 Professional Place Unit 14
- 145 Beamer Cir SW
- 115 Wayne St SW
- 122 Emory St SW
- 125 Wayne St SW
- 0 Emory St SW Unit 7396886
- 0 Emory St SW Unit 8693035
- 0 Emory St SW
- 103 Emory St SW
- 121 Emory St SW
- 136 Emory St SW
- 133 Wayne St SW
- 0 Wayne St SW Unit 7344863
- 0 Wayne St SW Unit 8046805
- 0 Wayne St SW Unit 7034785
- 0 Wayne St SW
- 108 Wayne St SW
- 121 Beamer Cir SW
- 148 Emory St SW
- 124 Wayne St SW
- 143 Wayne St SW