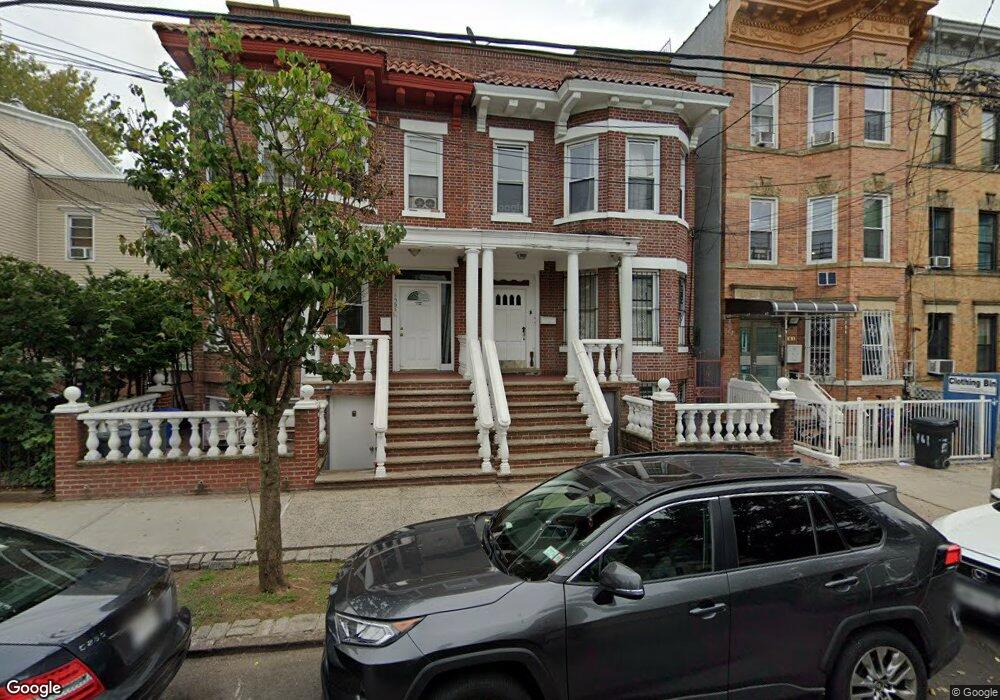
157 Chestnut St Brooklyn, NY 11208
Cypress Hills NeighborhoodEstimated Value: $934,000 - $977,000
Studio
--
Bath
2,264
Sq Ft
$421/Sq Ft
Est. Value
About This Home
This home is located at 157 Chestnut St, Brooklyn, NY 11208 and is currently estimated at $953,937, approximately $421 per square foot. 157 Chestnut St is a home located in Kings County with nearby schools including P.S. 65, Is 171 Abraham Lincoln, and Blessed Sacrament School.
Ownership History
Date
Name
Owned For
Owner Type
Purchase Details
Closed on
Mar 20, 2026
Sold by
Lopez Victor
Bought by
Lopez Lizette
Current Estimated Value
Purchase Details
Closed on
Jan 21, 2022
Sold by
Lopez Lizette
Bought by
Lopez Victor
Purchase Details
Closed on
Mar 30, 2021
Sold by
Rodriguez Francisca
Bought by
Lopez Lizette
Purchase Details
Closed on
Sep 23, 2002
Sold by
Rodriguez Francisca
Bought by
Rodriguez Francisca
Purchase Details
Closed on
May 28, 1998
Sold by
Value Associates Corp
Bought by
Rodriguez Francisca and Hernandez Nelson
Home Financials for this Owner
Home Financials are based on the most recent Mortgage that was taken out on this home.
Original Mortgage
$180,164
Interest Rate
6.92%
Mortgage Type
FHA
Purchase Details
Closed on
Aug 27, 1997
Sold by
The Chase Manhattan Bank and Chemical Bank
Bought by
Value Associates Corp
Create a Home Valuation Report for This Property
The Home Valuation Report is an in-depth analysis detailing your home's value as well as a comparison with similar homes in the area
Home Values in the Area
Average Home Value in this Area
Purchase History
We collect this data history from publicly available records. To have your information removed, we recommend requesting removal directly through your county’s website.
| Date | Buyer | Sale Price | Title Company |
|---|---|---|---|
| Lopez Lizette | -- | -- | |
| Lopez Victor | -- | -- | |
| Lopez Lizette | -- | -- | |
| Rodriguez Francisca | -- | -- | |
| Rodriguez Francisca | $186,000 | Fidelity National Title Ins | |
| Value Associates Corp | $115,000 | -- |
Source: Public Records
Mortgage History
We collect this data history from publicly available records. To have your information removed, we recommend requesting removal directly through your county’s website.
| Date | Status | Borrower | Loan Amount |
|---|---|---|---|
| Previous Owner | Rodriguez Francisca | $180,164 |
Source: Public Records
Tax History
| Year | Tax Paid | Tax Assessment Tax Assessment Total Assessment is a certain percentage of the fair market value that is determined by local assessors to be the total taxable value of land and additions on the property. | Land | Improvement |
|---|---|---|---|---|
| 2026 | $7,779 | $55,920 | $19,860 | $36,060 |
| 2025 | $7,340 | $58,800 | $19,860 | $38,940 |
| 2024 | $7,340 | $46,440 | $19,860 | $26,580 |
| 2023 | $7,363 | $50,520 | $19,860 | $30,660 |
| 2022 | $5,123 | $45,780 | $19,860 | $25,920 |
| 2021 | $6,793 | $45,420 | $19,860 | $25,560 |
| 2020 | $1,688 | $49,260 | $19,860 | $29,400 |
| 2019 | $6,371 | $49,260 | $19,860 | $29,400 |
| 2018 | $6,159 | $30,214 | $14,816 | $15,398 |
| 2017 | $5,812 | $28,513 | $12,946 | $15,567 |
| 2016 | $5,378 | $26,900 | $15,220 | $11,680 |
| 2015 | $3,244 | $26,896 | $17,898 | $8,998 |
| 2014 | $3,244 | $25,380 | $17,892 | $7,488 |
Source: Public Records
Map
Nearby Homes
- 165 Chestnut St
- 145 Chestnut St
- 342 Ridgewood Ave
- 169 Euclid Ave
- 3235 Fulton St
- 3225 Fulton St
- 3242 Fulton St
- 301 Ridgewood Ave
- 88 Chestnut St
- 65 Richmond St
- 9 Adler Place
- 60 Richmond St
- 54 Chestnut St
- 261 Etna St
- 2 Danforth St
- 266 Hemlock St
- 63 Norwood Ave
- 19 Kiely Place
- 298 Etna St
- 0 Force Tube Ave
- 155 Chestnut St
- 155 Chestnut St Unit Building
- 161 Chestnut St
- 163 Chestnut St
- 163 Chestnut St Unit 3
- 149 Chestnut St
- 167 Chestnut St
- 169 Chestnut St
- 173 Chestnut St
- 175 Chestnut St
- 176 Euclid Ave
- 360 Ridgewood Ave
- 356 Ridgewood Ave
- 174 Euclid Ave
- 362 Ridgewood Ave
- 178 Euclid Ave
- 354 Ridgewood Ave
- 364 Ridgewood Ave
- 352 Ridgewood Ave
- 177 Chestnut St
Your Personal Tour Guide
Ask me questions while you tour the home.