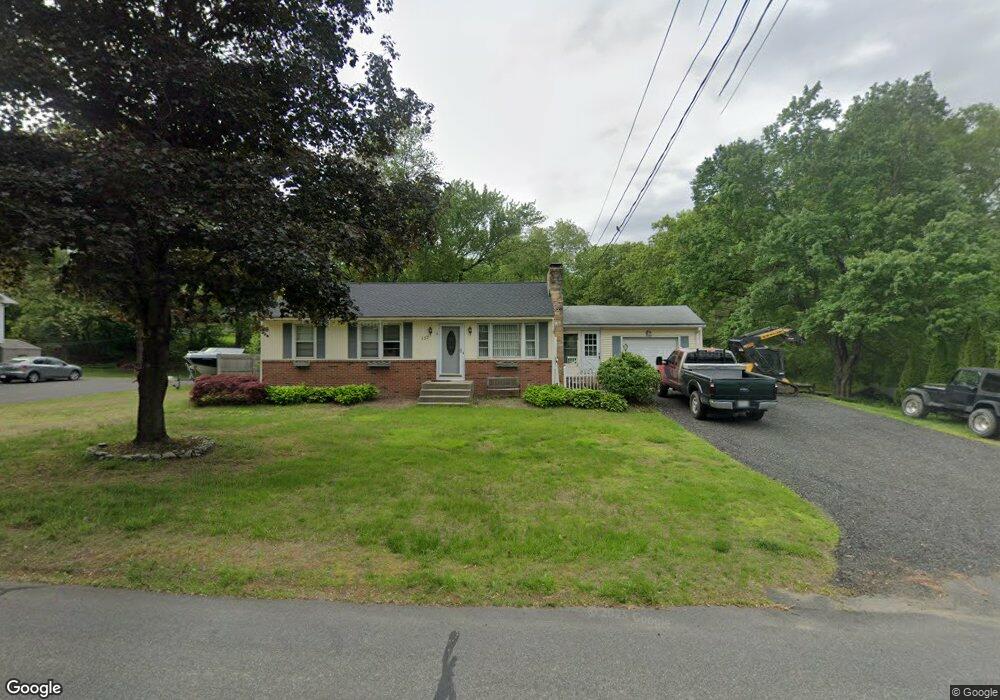
157 City View Rd Westfield, MA 01085
Estimated Value: $312,000 - $360,000
3
Beds
1
Bath
988
Sq Ft
$339/Sq Ft
Est. Value
About This Home
This home is located at 157 City View Rd, Westfield, MA 01085 and is currently estimated at $334,529, approximately $338 per square foot. 157 City View Rd is a home located in Hampden County with nearby schools including Westfield High School and Saint Mary High School.
Ownership History
Date
Name
Owned For
Owner Type
Purchase Details
Closed on
Jun 22, 2007
Sold by
Montanaro John and Montanaro Margaret R
Bought by
Lowe Christopher M
Current Estimated Value
Home Financials for this Owner
Home Financials are based on the most recent Mortgage that was taken out on this home.
Original Mortgage
$200,000
Outstanding Balance
$122,047
Interest Rate
6.14%
Mortgage Type
Purchase Money Mortgage
Estimated Equity
$212,482
Purchase Details
Closed on
Jan 9, 1989
Sold by
Hsing Rodney W
Bought by
Montanaro John
Home Financials for this Owner
Home Financials are based on the most recent Mortgage that was taken out on this home.
Original Mortgage
$119,079
Interest Rate
10.32%
Mortgage Type
Purchase Money Mortgage
Purchase Details
Closed on
Jun 1, 1987
Sold by
Swain Linda L
Bought by
Hsing Rodney W
Create a Home Valuation Report for This Property
The Home Valuation Report is an in-depth analysis detailing your home's value as well as a comparison with similar homes in the area
Home Values in the Area
Average Home Value in this Area
Purchase History
| Date | Buyer | Sale Price | Title Company |
|---|---|---|---|
| Lowe Christopher M | $200,000 | -- | |
| Montanaro John | $117,900 | -- | |
| Hsing Rodney W | $92,000 | -- |
Source: Public Records
Mortgage History
| Date | Status | Borrower | Loan Amount |
|---|---|---|---|
| Open | Lowe Christopher M | $200,000 | |
| Previous Owner | Hsing Rodney W | $117,750 | |
| Previous Owner | Hsing Rodney W | $19,620 | |
| Previous Owner | Hsing Rodney W | $4,137 | |
| Previous Owner | Hsing Rodney W | $119,079 |
Source: Public Records
Tax History Compared to Growth
Tax History
| Year | Tax Paid | Tax Assessment Tax Assessment Total Assessment is a certain percentage of the fair market value that is determined by local assessors to be the total taxable value of land and additions on the property. | Land | Improvement |
|---|---|---|---|---|
| 2025 | $4,164 | $274,300 | $120,400 | $153,900 |
| 2024 | $4,208 | $263,500 | $109,600 | $153,900 |
| 2023 | $4,063 | $239,300 | $104,400 | $134,900 |
| 2022 | $3,916 | $211,800 | $93,300 | $118,500 |
| 2021 | $5,567 | $200,800 | $88,100 | $112,700 |
| 2020 | $3,698 | $192,100 | $88,100 | $104,000 |
| 2019 | $3,606 | $183,300 | $83,700 | $99,600 |
| 2018 | $4,050 | $183,300 | $83,700 | $99,600 |
| 2017 | $4,049 | $180,100 | $84,800 | $95,300 |
| 2016 | $3,501 | $180,100 | $84,800 | $95,300 |
| 2015 | $3,339 | $180,100 | $84,800 | $95,300 |
| 2014 | $2,496 | $180,100 | $84,800 | $95,300 |
Source: Public Records
Map
Nearby Homes
- 128 Crane Ave
- 172 Valley View Dr
- 78 Granville Rd Unit 11
- 0 Fox Hill Dr
- 53 Yankee Cir
- 110 Kensington Ave
- 11 Highland Cir
- 82 S Maple St Unit 43
- 82 S Maple St Unit 11
- 69 Beveridge Blvd
- 508 Granville Rd
- 74 S Maple St
- 70 S Maple St
- 386 Hillside Rd
- 70-74 S Maple St
- 324 Russell Rd Unit 204
- 205 Russell Rd
- 197 Loomis Rg
- 15 Bates St
- 40 Heritage Ln
- 165 City View Rd
- 150 City View Rd
- 5 Butternut Rd
- 9 Butternut Rd
- 169 City View Rd
- 144 City View Rd
- 15 Butternut Rd
- 171 City View Rd
- 140 City View Rd
- 19 Butternut Rd
- 19 Butternut Rd
- 19 Butternut Rd Unit 1
- 16 Butternut Rd
- 170 City View Rd
- 29 Butternut Rd
- 23 Butternut Rd
- 20 Butternut Rd
- 132 City View Rd
- 24 Butternut Rd
- 27 Butternut Rd