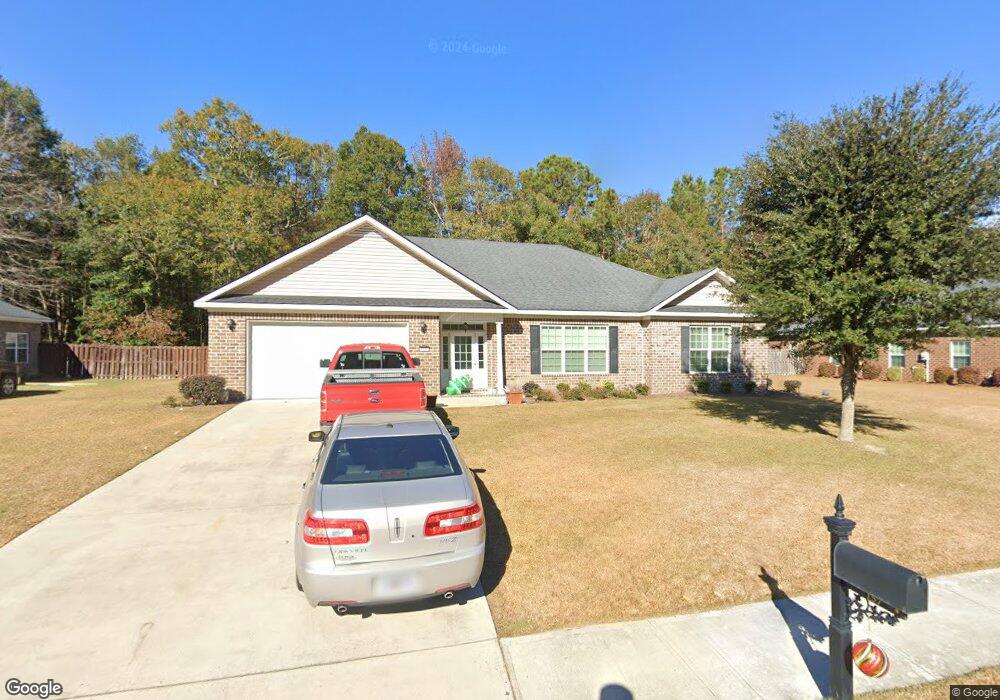
157 Cobbleton Dr Rincon, GA 31326
Estimated Value: $323,658 - $425,000
4
Beds
2
Baths
2,205
Sq Ft
$168/Sq Ft
Est. Value
About This Home
This home is located at 157 Cobbleton Dr, Rincon, GA 31326 and is currently estimated at $369,915, approximately $167 per square foot. 157 Cobbleton Dr is a home located in Effingham County with nearby schools including Ebenezer Elementary School, Ebenezer Middle School, and Effingham County High School.
Ownership History
Date
Name
Owned For
Owner Type
Purchase Details
Closed on
Jun 3, 2022
Sold by
Ashcraft Royce L
Bought by
Woods Carl W and Woods Hilary H
Current Estimated Value
Home Financials for this Owner
Home Financials are based on the most recent Mortgage that was taken out on this home.
Original Mortgage
$230,000
Outstanding Balance
$205,046
Interest Rate
5.27%
Mortgage Type
New Conventional
Estimated Equity
$164,869
Purchase Details
Closed on
Oct 14, 2016
Sold by
Amby Dev Inc
Bought by
Ashcraft Royce L and Howell Harriet Luann
Purchase Details
Closed on
Sep 7, 2013
Sold by
Ebenezer Real Estate Inc
Bought by
Amby Development Inc
Purchase Details
Closed on
Sep 7, 2012
Sold by
Southern Building & Develo
Bought by
Ebenezer Real Estate Inc
Purchase Details
Closed on
Sep 20, 2002
Bought by
Southern Building
Create a Home Valuation Report for This Property
The Home Valuation Report is an in-depth analysis detailing your home's value as well as a comparison with similar homes in the area
Home Values in the Area
Average Home Value in this Area
Purchase History
| Date | Buyer | Sale Price | Title Company |
|---|---|---|---|
| Woods Carl W | $230,000 | -- | |
| Ashcraft Royce L | $233,000 | -- | |
| Amby Development Inc | $408,000 | -- | |
| Ebenezer Real Estate Inc | -- | -- | |
| Southern Building | -- | -- |
Source: Public Records
Mortgage History
| Date | Status | Borrower | Loan Amount |
|---|---|---|---|
| Open | Woods Carl W | $230,000 |
Source: Public Records
Tax History
| Year | Tax Paid | Tax Assessment Tax Assessment Total Assessment is a certain percentage of the fair market value that is determined by local assessors to be the total taxable value of land and additions on the property. | Land | Improvement |
|---|---|---|---|---|
| 2025 | $4,011 | $137,095 | $28,000 | $109,095 |
| 2024 | $4,011 | $132,528 | $28,000 | $104,528 |
| 2023 | $2,325 | $140,028 | $22,800 | $117,228 |
| 2022 | $2,641 | $112,749 | $18,200 | $94,549 |
| 2021 | $2,557 | $108,199 | $16,000 | $92,199 |
| 2020 | $2,520 | $102,757 | $14,400 | $88,357 |
| 2019 | $2,441 | $95,073 | $14,400 | $80,673 |
| 2018 | $2,496 | $95,770 | $14,400 | $81,370 |
| 2017 | $2,436 | $88,721 | $14,400 | $74,321 |
| 2016 | $160 | $5,600 | $5,600 | $0 |
| 2015 | -- | $10,000 | $10,000 | $0 |
| 2014 | -- | $5,600 | $5,600 | $0 |
| 2013 | -- | $10,000 | $10,000 | $0 |
Source: Public Records
Map
Nearby Homes
- 102 Henry Ct
- 100 Alexander Trail
- 108 Treutlen Ct
- 111 Alexander Trail
- 104 Gnann Way
- 108 Alexander Trail
- 104 Alexander Trail
- 123 Alexander Trail
- 105 Lexus Ct
- 104 Lexus Ct
- 112 Ramsey Way
- 104 Speir Ct
- 115 Founders Dr
- 105 Burns Ct
- 108 Founders Dr
- 116 Founders Dr
- 118 Founders Dr
- 112 Founders Dr
- 114 Founders Dr
- 110 Founders Dr
- 155 Cobbleton Dr
- 159 Cobbleton Dr
- 144 Cobbleton Dr
- 153 Cobbleton Dr
- 161 Cobbleton Dr
- 142 Cobbleton Dr
- 151 Cobbleton Dr
- 140 Cobbleton Dr
- 149 Cobbleton Dr
- 138 Cobbleton Dr
- 147 Cobbleton Dr
- 895 Ebenezer Rd
- 136 Cobbleton Dr
- 915 Ebenezer Rd
- 939 Ebenezer Rd
- 127 Treutlen Ct Unit 14
- 125 Treutlen Ct
- 125 Treutlen Ct Unit 13
- 129 Treutlen Ct
- 129 Treutlen Ct Unit 15
Your Personal Tour Guide
Ask me questions while you tour the home.