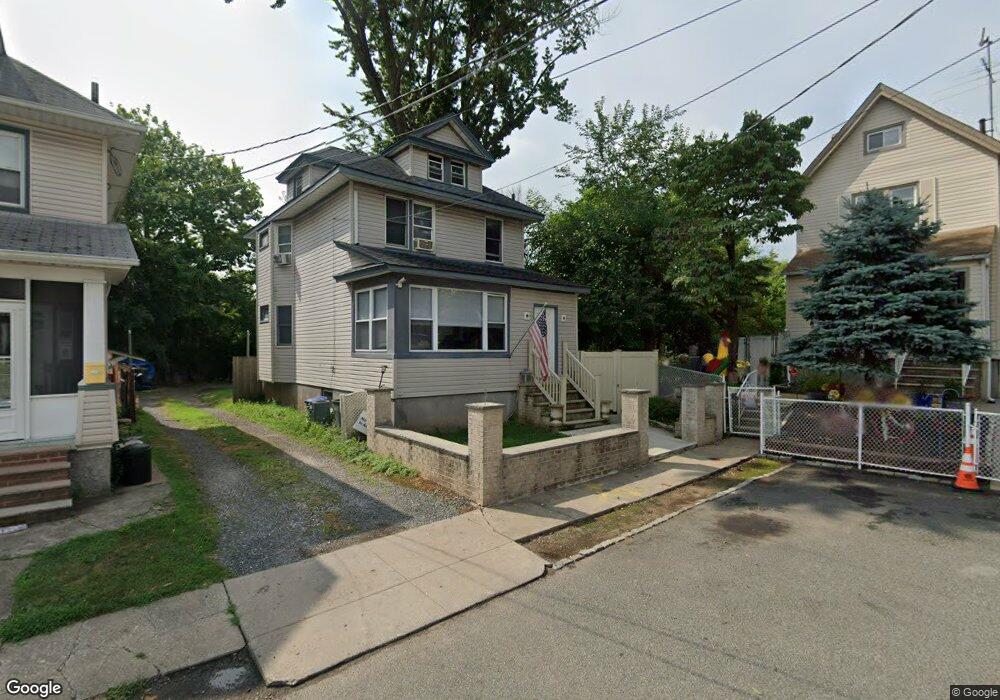
157 Cortlandt St Staten Island, NY 10302
Port Richmond NeighborhoodEstimated Value: $612,000 - $707,750
--
Bed
4
Baths
1,450
Sq Ft
$446/Sq Ft
Est. Value
About This Home
This home is located at 157 Cortlandt St, Staten Island, NY 10302 and is currently estimated at $646,688, approximately $445 per square foot. 157 Cortlandt St is a home located in Richmond County with nearby schools including P.S. 19 The Curtis School, Intermediate School 27, and Port Richmond High School.
Ownership History
Date
Name
Owned For
Owner Type
Purchase Details
Closed on
Nov 13, 2019
Sold by
Arcello Anthony
Bought by
Arcello Anthony E and Arcello Anthony M
Current Estimated Value
Home Financials for this Owner
Home Financials are based on the most recent Mortgage that was taken out on this home.
Original Mortgage
$459,910
Outstanding Balance
$414,194
Interest Rate
4.87%
Mortgage Type
FHA
Estimated Equity
$232,494
Purchase Details
Closed on
Mar 13, 2008
Sold by
Arcello Anthony and Arcello Sharon
Bought by
Arcello Anthony
Home Financials for this Owner
Home Financials are based on the most recent Mortgage that was taken out on this home.
Original Mortgage
$333,935
Interest Rate
6.22%
Mortgage Type
New Conventional
Purchase Details
Closed on
Oct 21, 1998
Sold by
Spauding Grace
Bought by
Arcello Anthony and Arcello Sharon
Create a Home Valuation Report for This Property
The Home Valuation Report is an in-depth analysis detailing your home's value as well as a comparison with similar homes in the area
Home Values in the Area
Average Home Value in this Area
Purchase History
| Date | Buyer | Sale Price | Title Company |
|---|---|---|---|
| Arcello Anthony E | -- | Bentley Abstract Inc | |
| Arcello Anthony | -- | The Judicial Title Insurance | |
| Arcello Anthony | $103,000 | First American Title Ins Co |
Source: Public Records
Mortgage History
| Date | Status | Borrower | Loan Amount |
|---|---|---|---|
| Open | Arcello Anthony E | $459,910 | |
| Closed | Arcello Anthony | $333,935 |
Source: Public Records
Tax History Compared to Growth
Tax History
| Year | Tax Paid | Tax Assessment Tax Assessment Total Assessment is a certain percentage of the fair market value that is determined by local assessors to be the total taxable value of land and additions on the property. | Land | Improvement |
|---|---|---|---|---|
| 2025 | $5,805 | $37,440 | $16,906 | $20,534 |
| 2024 | $5,805 | $35,280 | $17,941 | $17,339 |
| 2023 | $5,825 | $28,680 | $18,269 | $10,411 |
| 2022 | $5,402 | $27,960 | $21,900 | $6,060 |
| 2021 | $5,372 | $26,280 | $21,900 | $4,380 |
| 2020 | $5,098 | $26,760 | $21,900 | $4,860 |
| 2019 | $13,508 | $27,960 | $21,900 | $6,060 |
| 2018 | $4,872 | $23,900 | $16,972 | $6,928 |
| 2017 | $4,597 | $22,549 | $20,942 | $1,607 |
| 2016 | $4,253 | $21,273 | $16,806 | $4,467 |
| 2015 | $3,852 | $20,071 | $14,402 | $5,669 |
| 2014 | $3,852 | $20,071 | $15,089 | $4,982 |
Source: Public Records
Map
Nearby Homes
- 155 Cortlandt St
- 152 Cortlandt St
- 46 Catherine St
- 21 Dryden Ct
- 125 Decker Ave
- 67 Lexington Ave
- 1328 Forest Ave
- 25 Lexington Ave
- 322 Jewett Ave
- 328 Jewett Ave
- 263 Decker Ave
- 47 Montell St
- 99 Llewellyn Place
- 57 Burnside Ave
- 286 Jewett Ave
- 30 Decker Ave
- 172-174 Llewellyn Place
- 938 Post Ave
- 83 Palmer Ave
- 176 Dubois Ave
- 153 Cortlandt St
- 69 Catherine St
- 75 Catherine St
- 71 Catherine St
- 149 Cortlandt St
- 77 Catherine St
- 156 Cortlandt St
- 85 Catherine St
- 141 Cortlandt St Unit 145
- 141-145 Cortlandt St
- 81 Catherine St
- 150 Cortlandt St
- 87 Catherine St
- 68 Haughwout Ave
- 44 Catherine St Unit 46
- 44-46 Catherine St
- 148 Cortlandt St
- 129 Lexington Ave
- 125 Lexington Ave
- 50 Catherine St