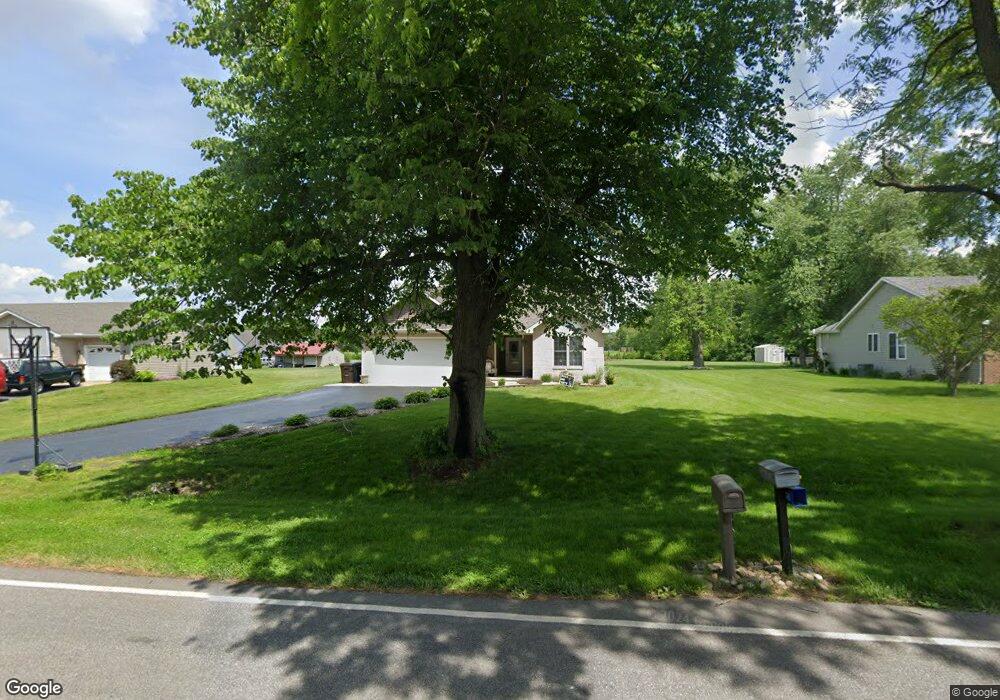
157 E 400 S Valparaiso, IN 46383
Porter County NeighborhoodEstimated Value: $335,000 - $414,736
3
Beds
3
Baths
1,412
Sq Ft
$274/Sq Ft
Est. Value
About This Home
This home is located at 157 E 400 S, Valparaiso, IN 46383 and is currently estimated at $386,434, approximately $273 per square foot. 157 E 400 S is a home located in Porter County with nearby schools including Morgan Township Elementary School, Morgan Township Middle/High School, and Midwest Academy.
Ownership History
Date
Name
Owned For
Owner Type
Purchase Details
Closed on
Oct 9, 2009
Sold by
Morris Paul David
Bought by
Morris Paul David and Morris Torie Louann
Current Estimated Value
Purchase Details
Closed on
May 22, 2008
Sold by
Freyenberger Aaron
Bought by
Morris Paul David
Home Financials for this Owner
Home Financials are based on the most recent Mortgage that was taken out on this home.
Original Mortgage
$161,000
Outstanding Balance
$102,652
Interest Rate
6.01%
Mortgage Type
Purchase Money Mortgage
Estimated Equity
$283,782
Create a Home Valuation Report for This Property
The Home Valuation Report is an in-depth analysis detailing your home's value as well as a comparison with similar homes in the area
Home Values in the Area
Average Home Value in this Area
Purchase History
| Date | Buyer | Sale Price | Title Company |
|---|---|---|---|
| Morris Paul David | -- | None Available | |
| Morris Paul David | -- | Ticor Title Ins |
Source: Public Records
Mortgage History
| Date | Status | Borrower | Loan Amount |
|---|---|---|---|
| Open | Morris Paul David | $161,000 |
Source: Public Records
Tax History
| Year | Tax Paid | Tax Assessment Tax Assessment Total Assessment is a certain percentage of the fair market value that is determined by local assessors to be the total taxable value of land and additions on the property. | Land | Improvement |
|---|---|---|---|---|
| 2024 | $2,659 | $433,800 | $37,000 | $396,800 |
| 2023 | $2,519 | $374,200 | $32,500 | $341,700 |
| 2022 | $2,452 | $339,200 | $32,500 | $306,700 |
| 2021 | $2,433 | $306,300 | $32,500 | $273,800 |
| 2020 | $2,193 | $279,700 | $28,300 | $251,400 |
| 2019 | $1,831 | $235,000 | $28,300 | $206,700 |
| 2018 | $1,727 | $226,200 | $28,300 | $197,900 |
| 2017 | $1,701 | $225,400 | $28,300 | $197,100 |
| 2016 | $1,544 | $212,700 | $28,900 | $183,800 |
| 2014 | $1,449 | $200,100 | $28,000 | $172,100 |
| 2013 | -- | $190,300 | $28,300 | $162,000 |
Source: Public Records
Map
Nearby Homes
- 334 S State Road 49
- 296 S 150 E
- 181 E 600 S
- 355 E 300 S
- 645 S 150 E
- 456 E 400 S
- 323 E 124 S
- 829 S Baums Bridge Rd
- 0 Smoke Rd
- 103 Mckinley St
- 204 N Main St
- Lot B4-5 St Road 8
- 48 E Division Rd
- 401 Sutton Ave
- 401 S Sutton Ave
- 3253 Mockingbird Ln
- 3252 Mockingbird Ln
- 3251 Mockingbird Ln
- 421 Amy Rose Ln
- 372 Radcliff Dr
Your Personal Tour Guide
Ask me questions while you tour the home.