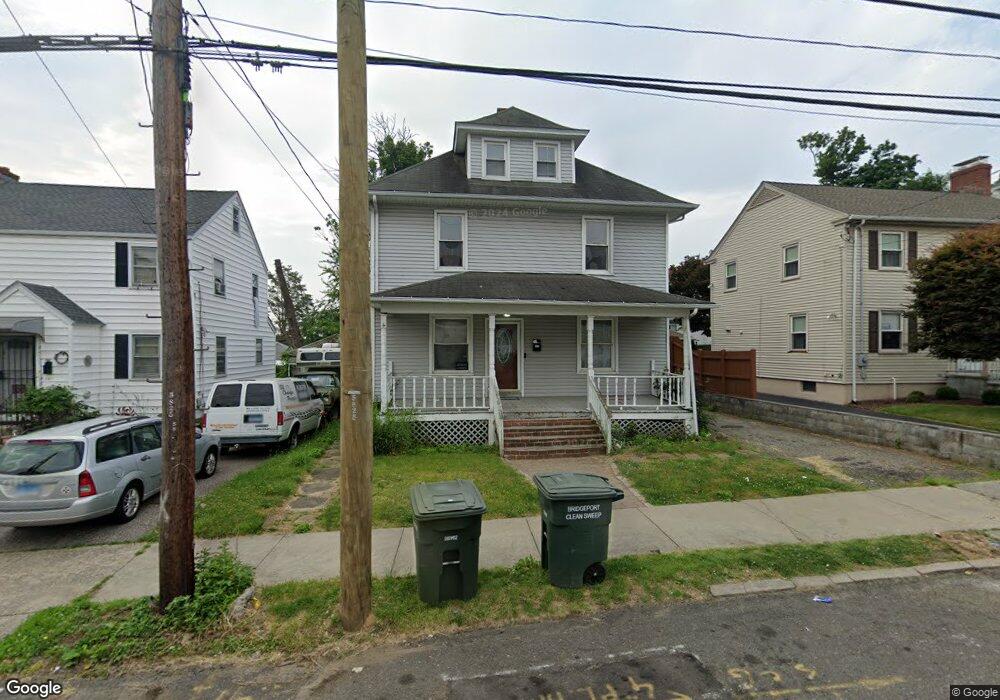
157 Fairview Ave Bridgeport, CT 06606
Brooklawn-Saint Vincent NeighborhoodEstimated Value: $401,000 - $445,000
4
Beds
2
Baths
1,957
Sq Ft
$216/Sq Ft
Est. Value
About This Home
This home is located at 157 Fairview Ave, Bridgeport, CT 06606 and is currently estimated at $423,170, approximately $216 per square foot. 157 Fairview Ave is a home located in Fairfield County with nearby schools including Read School, Central High School, and Catholic Academy of Bridgeport-St. Raphael Academy.
Ownership History
Date
Name
Owned For
Owner Type
Purchase Details
Closed on
Apr 10, 2006
Sold by
Spina Louis
Bought by
Stanko Dolores
Current Estimated Value
Home Financials for this Owner
Home Financials are based on the most recent Mortgage that was taken out on this home.
Original Mortgage
$216,000
Outstanding Balance
$137,951
Interest Rate
8.37%
Estimated Equity
$285,219
Purchase Details
Closed on
Jul 22, 2005
Sold by
Torres Heriberto and Torres Jennifer
Bought by
Spina Louis
Home Financials for this Owner
Home Financials are based on the most recent Mortgage that was taken out on this home.
Original Mortgage
$199,920
Interest Rate
5.59%
Purchase Details
Closed on
Feb 21, 2002
Sold by
Scott Nettie L
Bought by
Torres Heriberto and Torres Jennifer
Purchase Details
Closed on
Mar 13, 1995
Sold by
Linderfelt Ed and Linderfelt Maureen
Bought by
Scott Nettie L
Create a Home Valuation Report for This Property
The Home Valuation Report is an in-depth analysis detailing your home's value as well as a comparison with similar homes in the area
Home Values in the Area
Average Home Value in this Area
Purchase History
| Date | Buyer | Sale Price | Title Company |
|---|---|---|---|
| Stanko Dolores | $270,000 | -- | |
| Stanko Dolores | $270,000 | -- | |
| Spina Louis | $249,900 | -- | |
| Spina Louis | $249,900 | -- | |
| Torres Heriberto | $150,000 | -- | |
| Torres Heriberto | $150,000 | -- | |
| Scott Nettie L | $70,000 | -- | |
| Scott Nettie L | $70,000 | -- |
Source: Public Records
Mortgage History
| Date | Status | Borrower | Loan Amount |
|---|---|---|---|
| Open | Scott Nettie L | $216,000 | |
| Closed | Scott Nettie L | $216,000 | |
| Previous Owner | Scott Nettie L | $199,920 |
Source: Public Records
Tax History Compared to Growth
Tax History
| Year | Tax Paid | Tax Assessment Tax Assessment Total Assessment is a certain percentage of the fair market value that is determined by local assessors to be the total taxable value of land and additions on the property. | Land | Improvement |
|---|---|---|---|---|
| 2025 | $7,013 | $161,410 | $67,720 | $93,690 |
| 2024 | $7,013 | $161,410 | $67,720 | $93,690 |
| 2023 | $7,013 | $161,410 | $67,720 | $93,690 |
| 2022 | $7,013 | $161,410 | $67,720 | $93,690 |
| 2021 | $7,013 | $161,410 | $67,720 | $93,690 |
| 2020 | $6,497 | $120,330 | $41,040 | $79,290 |
| 2019 | $6,497 | $120,330 | $41,040 | $79,290 |
| 2018 | $6,542 | $120,330 | $41,040 | $79,290 |
| 2017 | $6,542 | $120,330 | $41,040 | $79,290 |
| 2016 | $6,542 | $120,330 | $41,040 | $79,290 |
| 2015 | $5,936 | $140,670 | $41,380 | $99,290 |
| 2014 | $5,936 | $140,670 | $41,380 | $99,290 |
Source: Public Records
Map
Nearby Homes
- 936 Lindley St
- 926 Hart St
- 916 Hart St
- 1265 Lindley St
- 5 Stevens St
- 106 Manhattan Ave Unit 108
- 123 Harlem Ave
- 39 Infield St
- 45 Stevens St Unit 2
- 508 Hawley Ave
- 138 Infield St
- 234 Savoy St
- 330 French St
- 203 Wayne St
- 3401 Main St
- 252 Harlem Ave Unit B6
- 252 Harlem Ave Unit B5
- 330 Oakwood St
- 631 Fairview Ave
- 105 Tremont Ave Unit E
- 147 Fairview Ave
- 167 Fairview Ave
- 139 Fairview Ave
- 129 Fairview Ave Unit 131
- 161 Fairview Ave
- 386 Anson St
- 158 Fairview Ave Unit 160
- 376 Anson St
- 389 Gurdon St Unit 391
- 130 Fairview Ave
- 148 Fairview Ave
- 174 Fairview Ave Unit 1
- 168 Fairview Ave Unit 170
- 381 Gurdon St
- 140 Fairview Ave Unit 142
- 140 Fairview Ave Unit 3
- 140 Fairview Ave Unit 1
- 142 Fairview Ave Unit 3
- 385 Anson St
- 366 Anson St