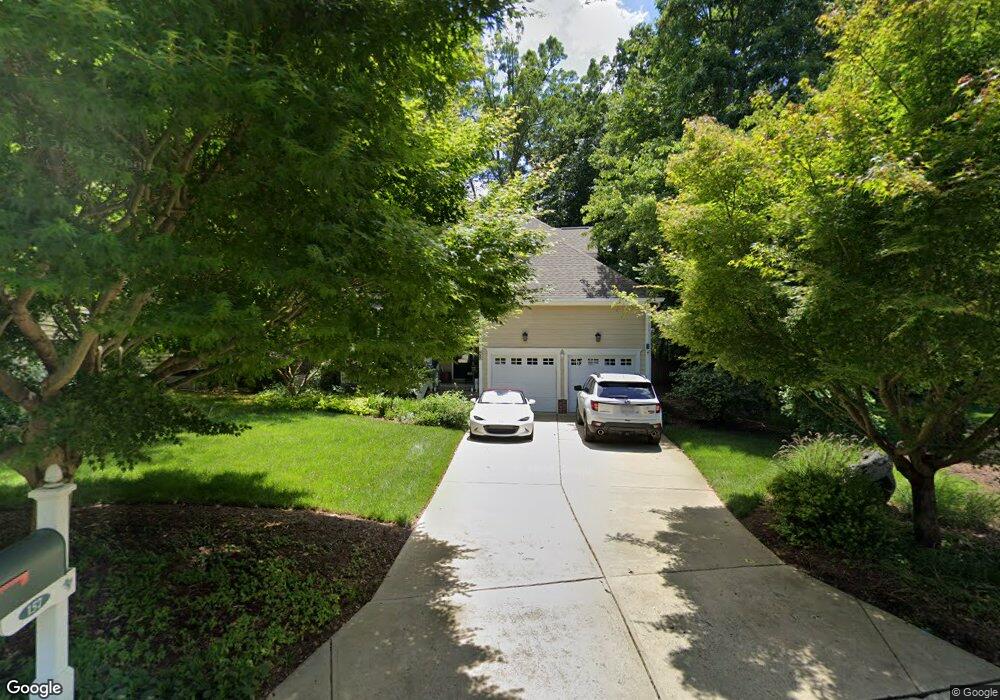
157 Fox Chapel Ln Pittsboro, NC 27312
Estimated Value: $460,997 - $504,000
4
Beds
3
Baths
2,040
Sq Ft
$236/Sq Ft
Est. Value
About This Home
This home is located at 157 Fox Chapel Ln, Pittsboro, NC 27312 and is currently estimated at $480,999, approximately $235 per square foot. 157 Fox Chapel Ln is a home located in Chatham County with nearby schools including Pittsboro Elementary School, George Moses Horton Middle School, and Northwood High.
Ownership History
Date
Name
Owned For
Owner Type
Purchase Details
Closed on
Apr 25, 2008
Sold by
Walsh Daniel G and Breen Walsh Nancy
Bought by
Raines Christena E and Swanson Carole
Current Estimated Value
Home Financials for this Owner
Home Financials are based on the most recent Mortgage that was taken out on this home.
Original Mortgage
$256,000
Outstanding Balance
$150,837
Interest Rate
4.75%
Mortgage Type
Purchase Money Mortgage
Estimated Equity
$330,162
Purchase Details
Closed on
Dec 7, 2006
Sold by
D Walsh Construction Inc
Bought by
Walsh Daniel G and Breen Walsh Nancy
Home Financials for this Owner
Home Financials are based on the most recent Mortgage that was taken out on this home.
Original Mortgage
$204,800
Interest Rate
6.31%
Mortgage Type
Purchase Money Mortgage
Create a Home Valuation Report for This Property
The Home Valuation Report is an in-depth analysis detailing your home's value as well as a comparison with similar homes in the area
Home Values in the Area
Average Home Value in this Area
Purchase History
| Date | Buyer | Sale Price | Title Company |
|---|---|---|---|
| Raines Christena E | $256,000 | None Available | |
| Walsh Daniel G | -- | None Available |
Source: Public Records
Mortgage History
| Date | Status | Borrower | Loan Amount |
|---|---|---|---|
| Open | Raines Christena E | $256,000 | |
| Previous Owner | Walsh Daniel G | $204,800 |
Source: Public Records
Tax History Compared to Growth
Tax History
| Year | Tax Paid | Tax Assessment Tax Assessment Total Assessment is a certain percentage of the fair market value that is determined by local assessors to be the total taxable value of land and additions on the property. | Land | Improvement |
|---|---|---|---|---|
| 2025 | $4,679 | $426,386 | $68,750 | $357,636 |
| 2024 | $4,679 | $288,572 | $62,500 | $226,072 |
| 2023 | $3,597 | $288,572 | $62,500 | $226,072 |
| 2022 | $3,346 | $283,837 | $62,500 | $221,337 |
| 2021 | $3,317 | $283,837 | $62,500 | $221,337 |
| 2020 | $3,122 | $265,304 | $46,350 | $218,954 |
| 2019 | $3,112 | $265,304 | $46,350 | $218,954 |
| 2018 | $2,981 | $265,304 | $46,350 | $218,954 |
| 2017 | $2,981 | $265,304 | $46,350 | $218,954 |
| 2016 | $2,917 | $257,872 | $45,000 | $212,872 |
| 2015 | $2,886 | $257,872 | $45,000 | $212,872 |
| 2014 | $2,886 | $257,872 | $45,000 | $212,872 |
| 2013 | -- | $257,872 | $45,000 | $212,872 |
Source: Public Records
Map
Nearby Homes
- 54 Pattishall Rd
- 24 Cynthia Ln
- 116 Kensington Dr
- 1157 Hillsboro St
- 186 Millennium Dr
- Tbd Versailles Ln
- 17 Plenty Ct
- 425 Credle St
- 298 E Salisbury St
- 142 Autumn Gate St
- 41 Cottage Way
- 710 Vine Pkwy
- 726 Thompson St
- 25 Juleann Ln
- 66 Toomer Loop Rd
- 162 Gaines Trail
- 230 Oakwood Dr
- 53 Circle City Way
- 11 Allgood St
- 122 Norwell Ln
- 145 Fox Chapel Ln
- 381 Fox Chapel Ln
- 108 Hawks Spiral Way
- 139 Fox Chapel Ln
- 110 Hawks Spiral Way
- 178 Fox Chapel Ln
- 154 Fox Chapel Ln
- 100 Hawks Spiral Way
- 142 Fox Chapel Ln
- 243 Springdale Dr
- 133 Fox Chapel Ln
- 136 Fox Chapel Ln
- 136 Fox Chapel Ln Unit 83
- 109 Hawks Spiral Way
- 125 Bellemont Rd
- 225 Springdale Dr
- 153 Bellemont Rd
- 172 Springdale Dr
- 130 Fox Chapel Ln
- 130 Fox Chapel Ln Unit 82