157 Francis St New Britain, CT 06053
Estimated Value: $177,000 - $319,000
4
Beds
2
Baths
1,715
Sq Ft
$157/Sq Ft
Est. Value
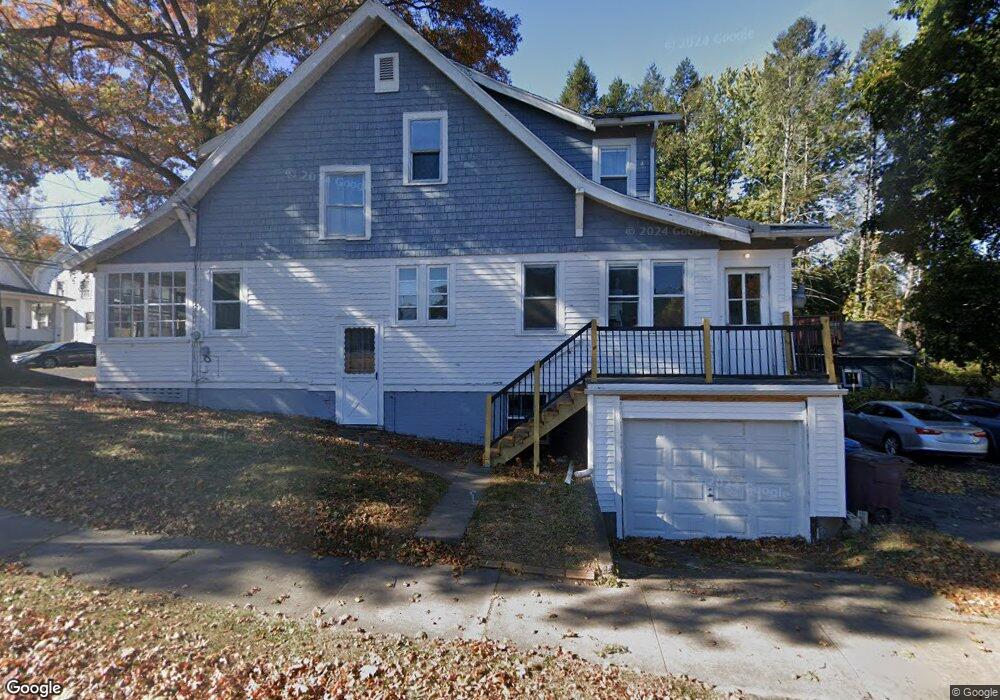
About This Home
This home is located at 157 Francis St, New Britain, CT 06053 and is currently estimated at $268,810, approximately $156 per square foot. 157 Francis St is a home located in Hartford County with nearby schools including Holmes School, Pulaski Middle School, and Mountain Laurel Sudbury School.
Ownership History
Date
Name
Owned For
Owner Type
Purchase Details
Closed on
Dec 6, 2023
Sold by
Dow Jr Earl M Est and Dow
Bought by
Central Prop Assoc Llc
Current Estimated Value
Home Financials for this Owner
Home Financials are based on the most recent Mortgage that was taken out on this home.
Original Mortgage
$130,000
Outstanding Balance
$127,750
Interest Rate
7.79%
Mortgage Type
Purchase Money Mortgage
Estimated Equity
$141,060
Create a Home Valuation Report for This Property
The Home Valuation Report is an in-depth analysis detailing your home's value as well as a comparison with similar homes in the area
Home Values in the Area
Average Home Value in this Area
Purchase History
| Date | Buyer | Sale Price | Title Company |
|---|---|---|---|
| Central Prop Assoc Llc | $150,000 | None Available |
Source: Public Records
Mortgage History
| Date | Status | Borrower | Loan Amount |
|---|---|---|---|
| Open | Central Prop Assoc Llc | $130,000 |
Source: Public Records
Tax History Compared to Growth
Tax History
| Year | Tax Paid | Tax Assessment Tax Assessment Total Assessment is a certain percentage of the fair market value that is determined by local assessors to be the total taxable value of land and additions on the property. | Land | Improvement |
|---|---|---|---|---|
| 2025 | $6,127 | $156,380 | $57,260 | $99,120 |
| 2024 | $6,191 | $156,380 | $57,260 | $99,120 |
| 2023 | $5,986 | $156,380 | $57,260 | $99,120 |
| 2022 | $4,751 | $95,970 | $26,390 | $69,580 |
| 2021 | $4,751 | $95,970 | $26,390 | $69,580 |
| 2020 | $4,846 | $95,970 | $26,390 | $69,580 |
| 2019 | $4,846 | $95,970 | $26,390 | $69,580 |
| 2018 | $4,846 | $95,970 | $26,390 | $69,580 |
| 2017 | $4,412 | $87,360 | $24,080 | $63,280 |
| 2016 | $4,412 | $87,360 | $24,080 | $63,280 |
| 2015 | $4,281 | $87,360 | $24,080 | $63,280 |
| 2014 | $4,281 | $87,360 | $24,080 | $63,280 |
Source: Public Records
Map
Nearby Homes
- 53 Park Dr
- 1634 Stanley St
- 91 Brighton St
- 335 Commonwealth Ave
- 34 Oneida St
- 16 Vincent Ave
- 1403 Stanley St
- 426 Allen St
- 51 Tunxis St
- 258 Eddy Glover Blvd
- 227 Amherst St
- 37 Recano Rd
- 262 Tremont St
- 220 Lasalle St Unit B4
- 31 Acorn St
- 394 Mcclintock St
- 108 Commonwealth Ave
- 1241 East St Unit C2
- 104 Daly Ave
- 1243 East St Unit F