Estimated Value: $538,000 - $642,037
3
Beds
4
Baths
4,671
Sq Ft
$129/Sq Ft
Est. Value
About This Home
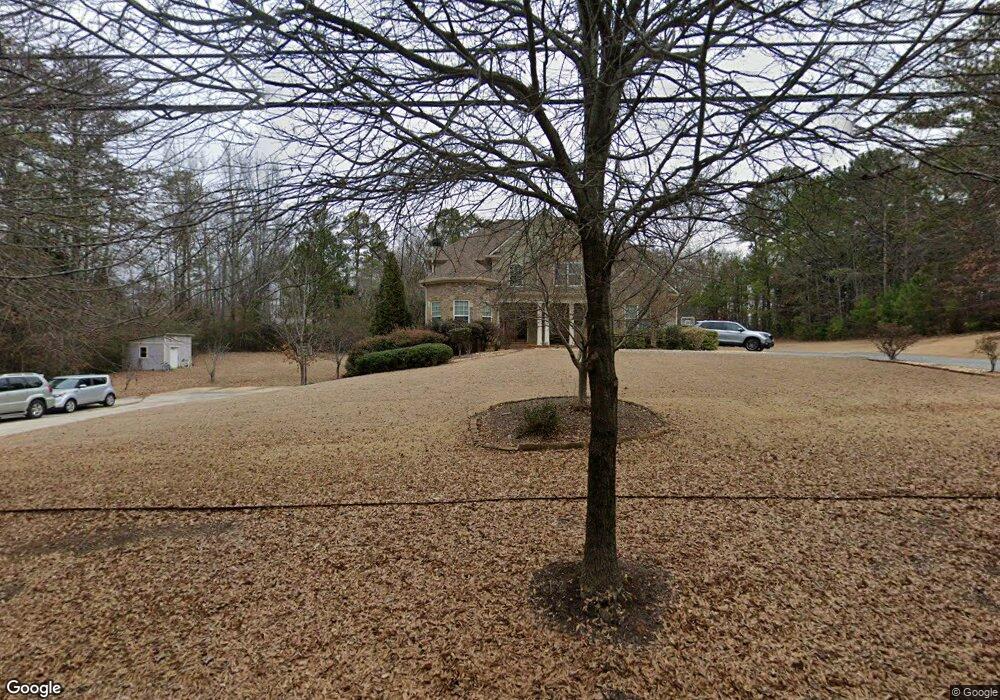
This home is located at 157 Garmon Rd, Hiram, GA 30141 and is currently estimated at $603,259, approximately $129 per square foot. 157 Garmon Rd is a home located in Paulding County with nearby schools including Sam D. Panter Elementary School, J. A. Dobbins Middle School, and Hiram High School.
Ownership History
Date
Name
Owned For
Owner Type
Purchase Details
Closed on
Oct 25, 2024
Sold by
Gardy Leandre
Bought by
Blanton Marshall
Current Estimated Value
Purchase Details
Closed on
Dec 20, 2019
Sold by
Bobo Novella
Bought by
Leandre Gardy
Home Financials for this Owner
Home Financials are based on the most recent Mortgage that was taken out on this home.
Original Mortgage
$315,000
Interest Rate
3.6%
Mortgage Type
New Conventional
Purchase Details
Closed on
Dec 21, 2007
Sold by
Leandre Gardy
Bought by
Leandre Gardy and Bobo Novella
Home Financials for this Owner
Home Financials are based on the most recent Mortgage that was taken out on this home.
Original Mortgage
$302,000
Interest Rate
6.21%
Mortgage Type
New Conventional
Purchase Details
Closed on
Sep 24, 2007
Sold by
Lanning Donna G
Bought by
Leandre Gardy
Create a Home Valuation Report for This Property
The Home Valuation Report is an in-depth analysis detailing your home's value as well as a comparison with similar homes in the area
Home Values in the Area
Average Home Value in this Area
Purchase History
| Date | Buyer | Sale Price | Title Company |
|---|---|---|---|
| Blanton Marshall | $15,000 | -- | |
| Leandre Gardy | -- | -- | |
| Leandre Gardy | -- | -- | |
| Leandre Gardy | $45,000 | -- |
Source: Public Records
Mortgage History
| Date | Status | Borrower | Loan Amount |
|---|---|---|---|
| Previous Owner | Leandre Gardy | $315,000 | |
| Previous Owner | Leandre Gardy | $302,000 |
Source: Public Records
Tax History Compared to Growth
Tax History
| Year | Tax Paid | Tax Assessment Tax Assessment Total Assessment is a certain percentage of the fair market value that is determined by local assessors to be the total taxable value of land and additions on the property. | Land | Improvement |
|---|---|---|---|---|
| 2024 | $6,661 | $267,764 | $23,280 | $244,484 |
| 2023 | $6,682 | $256,328 | $22,680 | $233,648 |
| 2022 | $6,062 | $232,528 | $18,440 | $214,088 |
| 2021 | $5,175 | $178,084 | $14,640 | $163,444 |
| 2020 | $4,813 | $162,048 | $13,840 | $148,208 |
| 2019 | $4,292 | $144,312 | $14,640 | $129,672 |
| 2018 | $5,161 | $173,156 | $13,760 | $159,396 |
| 2017 | $4,658 | $154,356 | $13,160 | $141,196 |
| 2016 | $3,912 | $131,252 | $13,160 | $118,092 |
| 2015 | $3,735 | $123,216 | $12,920 | $110,296 |
| 2014 | $3,452 | $111,228 | $11,880 | $99,348 |
| 2013 | -- | $107,200 | $13,040 | $94,160 |
Source: Public Records
Map
Nearby Homes
- 14 Riverstone Dr
- 73 Riverstone Dr
- 4970 Nebo Rd
- 18 Hawk Dr
- 496 Hughes Rd
- 6 Creekside Bluff
- 51 White Path Dr
- 56 Creekside Point
- 59 Creekside Bluff
- 122 Hale Mountain Ct
- 178 Hunters Mill Dr
- 19 Creekside View
- 333 Lake Swan Ct
- 333 Ct
- 75 Clay Ct
- 179 Country Club Dr
- 1616 Mcclung Rd
- 87 Country Club Ct
- 617 Kyles Cir
- 35 Oakmont Pass
- 4804 Nebo Rd
- 97 Garmon Rd
- 4755 Nebo Rd
- 4779 Nebo Rd
- 35 Edgewood Dr
- 211 Garmon Rd
- 4834 Nebo Rd
- 73 Garmon Rd
- 54 Riverstone Dr
- 18 Edgewood Dr Unit 46
- 18 Edgewood Dr
- 65 Edgewood Dr
- Lot22 The Highlands Unit Lot 22
- Lot22 The Highlands
- 233 Garmon Rd
- 42 Edgewood Dr
- 4849 Nebo Rd
- 89 Edgewood Dr Unit 5
- 89 Edgewood Dr
- 40 Garmon Rd