B
Landlord's Agent in 2023
Boomer Lee Palmer
The Home Rental Team LLC
(912) 483-8767
2 Total Sales

Estimated Value: $349,000 - $429,000
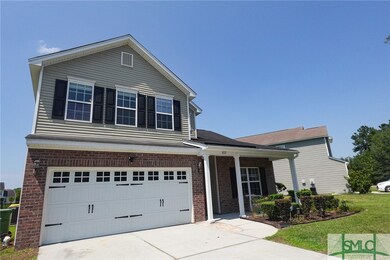
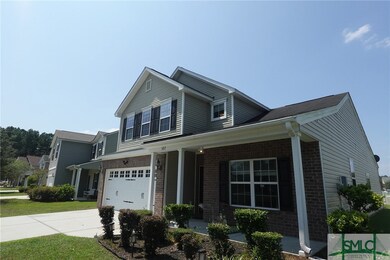
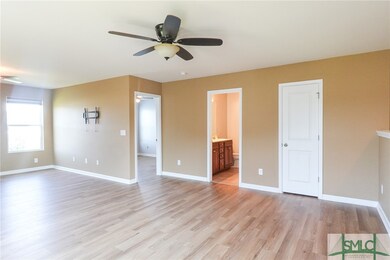
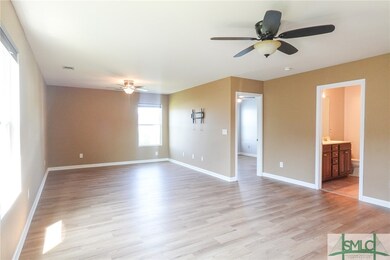
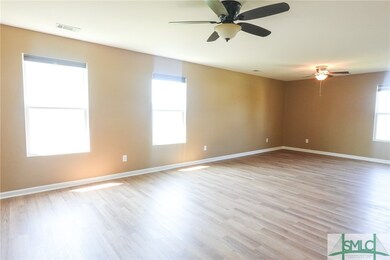
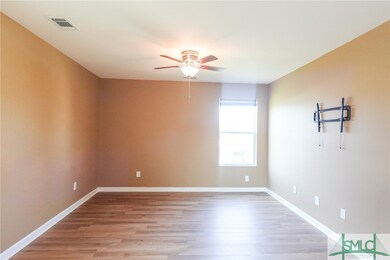
This stunning house is located in the desirable neighborhood of Pooler, GA. With 4 bedrooms and 2.5 bathrooms, this spacious home offers plenty of room for you and your loved ones. The open floor plan creates a welcoming atmosphere, perfect for entertaining guests or simply enjoying quality time with family. Step outside and discover the fantastic amenities this community has to offer. Take advantage of the clubhouse, community pool, or let the little ones burn off some energy at the community playground. With these amenities, there's always something fun to do right at your doorstep. The location of this house is ideal, providing easy access to nearby schools, shopping centers, and dining options. Don't miss out on the opportunity to make this house your home. Contact us today to schedule a tour and see for yourself!
Last Agent to Rent the Property
The Home Rental Team LLC License #320344 Listed on: 08/28/2023
| Date | Buyer | Sale Price | Title Company |
|---|---|---|---|
| Copeland Terrence R | $191,236 | -- | |
| Copeland Terrence R | $191,236 | -- |
| Date | Status | Borrower | Loan Amount |
|---|---|---|---|
| Open | Copeland Terrence R | $195,347 | |
| Closed | Copeland Terrence R | $195,347 |
| Date | Event | Price | Change | Sq Ft Price |
|---|---|---|---|---|
| 08/28/2023 08/28/23 | For Rent | $2,450 | 0.0% | -- |
| 08/28/2023 08/28/23 | Rented | $2,450 | -- | -- |
| Year | Tax Paid | Tax Assessment Tax Assessment Total Assessment is a certain percentage of the fair market value that is determined by local assessors to be the total taxable value of land and additions on the property. | Land | Improvement |
|---|---|---|---|---|
| 2025 | -- | $170,600 | $24,000 | $146,600 |
| 2024 | -- | $149,120 | $24,000 | $125,120 |
| 2023 | -- | $139,920 | $16,000 | $123,920 |
| 2022 | $16 | $112,520 | $16,000 | $96,520 |
| 2021 | $16 | $98,120 | $16,000 | $82,120 |
| 2020 | $16 | $95,600 | $16,000 | $79,600 |
| 2019 | $16 | $96,080 | $16,000 | $80,080 |
| 2018 | $77 | $92,920 | $16,000 | $76,920 |
| 2017 | $148 | $82,400 | $16,000 | $66,400 |
| 2016 | $2,613 | $81,440 | $16,000 | $65,440 |
| 2015 | $2,652 | $82,240 | $16,000 | $66,240 |
| 2014 | $3,906 | $82,120 | $0 | $0 |
B
Landlord's Agent in 2023
Boomer Lee Palmer
The Home Rental Team LLC
(912) 483-8767
2 Total Sales
Source: Savannah Multi-List Corporation
MLS Number: 294538
APN: 51009K04058
Disclaimer: Certain information contained herein is derived from information provided by parties other than Homes.com. All information provided is deemed reliable, but is not guaranteed to be accurate and should be independently verified.
![]() IDX information is provided exclusively for personal, non-commercial use, and may not be used for any purpose other than to identify prospective properties consumers may be interested in purchasing.
IDX information is provided exclusively for personal, non-commercial use, and may not be used for any purpose other than to identify prospective properties consumers may be interested in purchasing.
Information is deemed reliable but not guaranteed.
