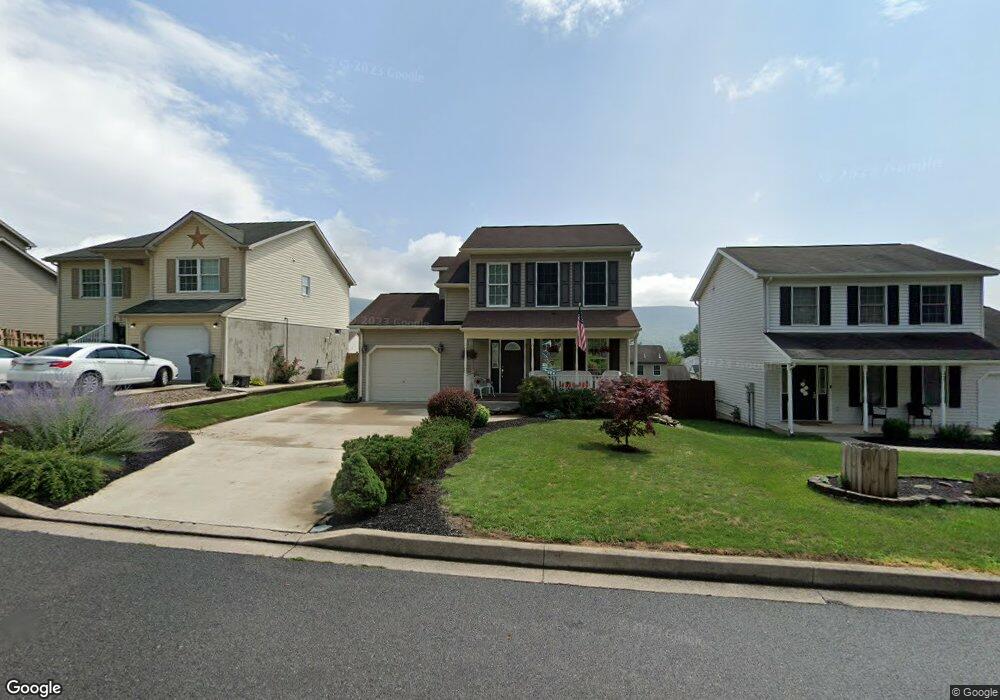
157 Laurel Run Cir Williamsport, PA 17701
Estimated Value: $198,000 - $214,000
3
Beds
1
Bath
1,045
Sq Ft
$196/Sq Ft
Est. Value
About This Home
This home is located at 157 Laurel Run Cir, Williamsport, PA 17701 and is currently estimated at $204,548, approximately $195 per square foot. 157 Laurel Run Cir is a home located in Lycoming County with nearby schools including Jackson Elementary School, Lycoming Valley Intermediate School, and Williamsport Area Senior High School.
Ownership History
Date
Name
Owned For
Owner Type
Purchase Details
Closed on
May 16, 2018
Sold by
Ulrich Jordan V and Ulrich Kari L
Bought by
Mitchell Terry K and Mitchell Karen L
Current Estimated Value
Home Financials for this Owner
Home Financials are based on the most recent Mortgage that was taken out on this home.
Original Mortgage
$119,600
Outstanding Balance
$102,980
Interest Rate
4.4%
Mortgage Type
New Conventional
Estimated Equity
$101,568
Purchase Details
Closed on
Feb 29, 2012
Sold by
Snyder Justin F and Snyder Kira J
Bought by
Ulrich Jordan V and Ulrich Kari L
Purchase Details
Closed on
Apr 24, 2007
Sold by
Williams David W and Williams Leslie K
Bought by
Snyder Justin F and Snyder Kira J
Home Financials for this Owner
Home Financials are based on the most recent Mortgage that was taken out on this home.
Original Mortgage
$118,960
Interest Rate
6.18%
Mortgage Type
FHA
Create a Home Valuation Report for This Property
The Home Valuation Report is an in-depth analysis detailing your home's value as well as a comparison with similar homes in the area
Home Values in the Area
Average Home Value in this Area
Purchase History
| Date | Buyer | Sale Price | Title Company |
|---|---|---|---|
| Mitchell Terry K | $130,000 | None Available | |
| Ulrich Jordan V | $120,000 | -- | |
| Snyder Justin F | $119,900 | None Available |
Source: Public Records
Mortgage History
| Date | Status | Borrower | Loan Amount |
|---|---|---|---|
| Open | Mitchell Terry K | $119,600 | |
| Previous Owner | Snyder Justin F | $118,960 |
Source: Public Records
Tax History Compared to Growth
Tax History
| Year | Tax Paid | Tax Assessment Tax Assessment Total Assessment is a certain percentage of the fair market value that is determined by local assessors to be the total taxable value of land and additions on the property. | Land | Improvement |
|---|---|---|---|---|
| 2025 | $4,257 | $104,360 | $22,610 | $81,750 |
| 2024 | $4,222 | $104,360 | $22,610 | $81,750 |
| 2023 | $4,170 | $104,360 | $22,610 | $81,750 |
| 2022 | $4,170 | $104,360 | $22,610 | $81,750 |
| 2021 | $4,134 | $104,360 | $22,610 | $81,750 |
| 2020 | $4,082 | $104,360 | $22,610 | $81,750 |
| 2019 | $4,015 | $104,360 | $22,610 | $81,750 |
| 2018 | $3,901 | $104,360 | $22,610 | $81,750 |
| 2017 | $3,787 | $104,360 | $22,610 | $81,750 |
| 2016 | $3,505 | $104,360 | $22,610 | $81,750 |
| 2015 | $2,610 | $104,360 | $22,610 | $81,750 |
Source: Public Records
Map
Nearby Homes
- 104 Laurel Run Cir
- 3356 W 4th St
- 2829 Dove St
- 2712 Grand St
- 313 Princeton Avenue Extension
- 20 Hillview Ave
- 15 Hemlock Rd
- 2317 Dove St
- 59 Keyser Cir
- 710 Mcminn Ave
- 2272 Cummings St
- 734 Pearl St
- 52 Overhill Rd
- 2128 W 4th St
- 1477 Pennsylvania 654
- 2301 Mosser Ave
- 2224 Lincoln St Unit +2223 BOYD CT
- 113 W Hills Dr
- 2006 Federal Ave Unit 2008
- 718 Arch St
- 155 Laurel Run Cir
- 159 Laurel Run Cir
- 158 Laurel Run Cir
- 140 & 142 Laurel Run Cir
- 175 Laurel Run Cir
- 153 Laurel Run Cir
- 161 Laurel Run Cir
- 107 Laurel Run Cir
- 105 Laurel Run Cir
- 109 Laurel Run Cir
- 156 Laurel Run Cir
- 151 Laurel Run Cir
- 154 Laurel Run Cir
- 111 Laurel Run Cir
- 103 Laurel Run Cir
- 152 Laurel Run Cir
- 165 Laurel Run Cir
- 160 Laurel Run Cir
- 149 Laurel Run Cir
- 150 Laurel Ruh Cir Unit LOT 25