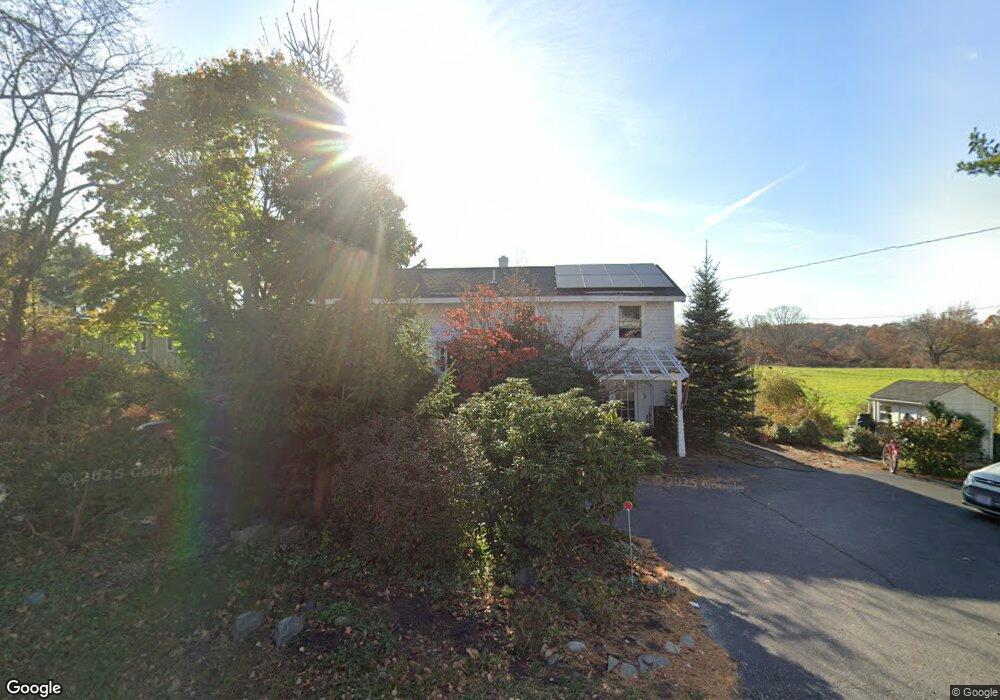
157 Low St Newburyport, MA 01950
Estimated Value: $766,000 - $862,000
3
Beds
3
Baths
1,100
Sq Ft
$728/Sq Ft
Est. Value
About This Home
This home is located at 157 Low St, Newburyport, MA 01950 and is currently estimated at $800,335, approximately $727 per square foot. 157 Low St is a home located in Essex County with nearby schools including Francis T. Bresnahan Elementary School, Edward G. Molin Elementary School, and Rupert A. Nock Middle School.
Ownership History
Date
Name
Owned For
Owner Type
Purchase Details
Closed on
Dec 23, 2024
Sold by
Hendrickson Dyke C and Hendrickson Victoria L
Bought by
Hendrickson Ft and Hendrickson
Current Estimated Value
Purchase Details
Closed on
Jul 13, 1998
Sold by
Malgeri Edna P
Bought by
Hendrickson Dyke C and Hendrickson Victoria L
Purchase Details
Closed on
Jul 1, 1992
Sold by
Economou John C and Economou Mary Jane
Bought by
Malgeri Edna P
Purchase Details
Closed on
Jun 9, 1988
Sold by
Wilson S Victor
Bought by
Economou John C
Create a Home Valuation Report for This Property
The Home Valuation Report is an in-depth analysis detailing your home's value as well as a comparison with similar homes in the area
Home Values in the Area
Average Home Value in this Area
Purchase History
| Date | Buyer | Sale Price | Title Company |
|---|---|---|---|
| Hendrickson Ft | -- | None Available | |
| Hendrickson Ft | -- | None Available | |
| Hendrickson Dyke C | $190,000 | -- | |
| Malgeri Edna P | $142,500 | -- | |
| Hendrickson Dyke C | $190,000 | -- | |
| Malgeri Edna P | $142,500 | -- | |
| Economou John C | $175,000 | -- |
Source: Public Records
Mortgage History
| Date | Status | Borrower | Loan Amount |
|---|---|---|---|
| Previous Owner | Economou John C | $186,000 | |
| Previous Owner | Economou John C | $200,000 |
Source: Public Records
Tax History Compared to Growth
Tax History
| Year | Tax Paid | Tax Assessment Tax Assessment Total Assessment is a certain percentage of the fair market value that is determined by local assessors to be the total taxable value of land and additions on the property. | Land | Improvement |
|---|---|---|---|---|
| 2025 | $6,889 | $719,100 | $400,100 | $319,000 |
| 2024 | $6,807 | $682,700 | $363,700 | $319,000 |
| 2023 | $6,447 | $600,300 | $316,200 | $284,100 |
| 2022 | $5,999 | $499,500 | $263,500 | $236,000 |
| 2021 | $5,397 | $427,000 | $239,600 | $187,400 |
| 2020 | $5,511 | $429,200 | $239,600 | $189,600 |
| 2019 | $5,614 | $429,200 | $239,600 | $189,600 |
| 2018 | $5,451 | $411,100 | $228,200 | $182,900 |
| 2017 | $5,271 | $391,900 | $217,400 | $174,500 |
| 2016 | $5,163 | $385,600 | $207,000 | $178,600 |
| 2015 | $4,730 | $354,600 | $207,000 | $147,600 |
Source: Public Records
Map
Nearby Homes
- 2 Hunter Dr
- 138 Low St
- 29 Columbus Ave
- 14 Farrell St
- 14 Norman Ave
- 6 Doe Run Dr
- 42 Myrtle Ave
- 6 Summit Place
- 30 Oakland St Unit 2
- 347 High St
- 26 Oakland St
- 15 Howard St
- 14 Dexter Ln Unit 1
- 27 Warren St Unit 1
- 22 Kent St Unit 1
- 217 Merrimac St Unit 1
- 2 River St
- 240 Merrimac St Unit 4
- 45 Boardman St Unit 1
- 19 Jefferson St