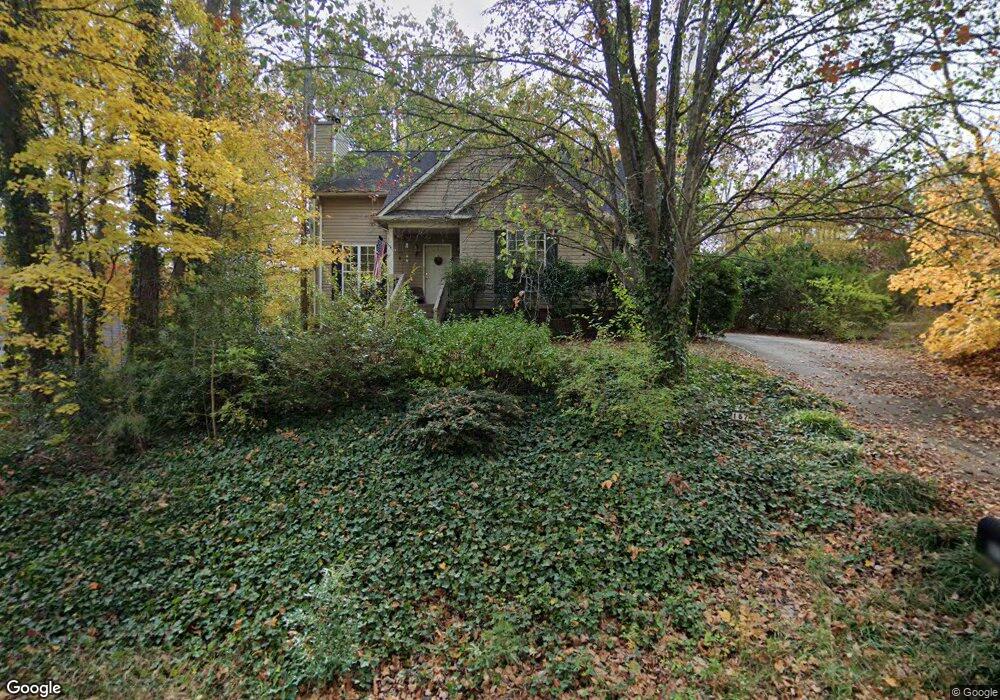
157 May St NE Concord, NC 28025
Estimated Value: $256,163 - $297,000
3
Beds
2
Baths
1,212
Sq Ft
$224/Sq Ft
Est. Value
About This Home
This home is located at 157 May St NE, Concord, NC 28025 and is currently estimated at $271,041, approximately $223 per square foot. 157 May St NE is a home located in Cabarrus County with nearby schools including W.M. Irvin Elementary School, Concord Middle School, and Concord High School.
Ownership History
Date
Name
Owned For
Owner Type
Purchase Details
Closed on
Aug 19, 2019
Sold by
Cressy Leslie N and Cressy Gerard
Bought by
Nelson Jeffrey M
Current Estimated Value
Home Financials for this Owner
Home Financials are based on the most recent Mortgage that was taken out on this home.
Original Mortgage
$135,000
Outstanding Balance
$118,235
Interest Rate
3.7%
Mortgage Type
New Conventional
Estimated Equity
$152,806
Purchase Details
Closed on
Jun 19, 2019
Sold by
Nelson Jeffrey Mark and Cressy Leslie N
Bought by
Cressy Leslie N and Clouzeau Suzanne
Purchase Details
Closed on
Dec 28, 1998
Sold by
Quickel Development Company Inc
Bought by
Nelson Jo Anne G
Home Financials for this Owner
Home Financials are based on the most recent Mortgage that was taken out on this home.
Original Mortgage
$80,250
Interest Rate
7.87%
Purchase Details
Closed on
May 22, 1998
Sold by
Mccrimmon John H and Mccrimmon Judy P
Bought by
Quickel Development Company Inc
Create a Home Valuation Report for This Property
The Home Valuation Report is an in-depth analysis detailing your home's value as well as a comparison with similar homes in the area
Home Values in the Area
Average Home Value in this Area
Purchase History
| Date | Buyer | Sale Price | Title Company |
|---|---|---|---|
| Nelson Jeffrey M | $145,000 | None Available | |
| Cressy Leslie N | -- | None Available | |
| Nelson Jo Anne G | $107,000 | -- | |
| Quickel Development Company Inc | $12,000 | -- |
Source: Public Records
Mortgage History
| Date | Status | Borrower | Loan Amount |
|---|---|---|---|
| Open | Nelson Jeffrey M | $135,000 | |
| Previous Owner | Nelson Jo Anne G | $80,250 |
Source: Public Records
Tax History
| Year | Tax Paid | Tax Assessment Tax Assessment Total Assessment is a certain percentage of the fair market value that is determined by local assessors to be the total taxable value of land and additions on the property. | Land | Improvement |
|---|---|---|---|---|
| 2025 | $2,370 | $237,920 | $52,000 | $185,920 |
| 2024 | $2,370 | $237,920 | $52,000 | $185,920 |
| 2023 | $1,722 | $141,180 | $25,000 | $116,180 |
| 2022 | $1,722 | $141,180 | $25,000 | $116,180 |
| 2021 | $1,722 | $141,180 | $25,000 | $116,180 |
| 2020 | $1,722 | $141,180 | $25,000 | $116,180 |
| 2019 | $625 | $102,450 | $12,000 | $90,450 |
| 2018 | $615 | $102,450 | $12,000 | $90,450 |
| 2017 | $604 | $102,450 | $12,000 | $90,450 |
| 2016 | $359 | $106,050 | $20,000 | $86,050 |
| 2015 | -- | $106,050 | $20,000 | $86,050 |
| 2014 | -- | $106,050 | $20,000 | $86,050 |
Source: Public Records
Map
Nearby Homes
- 161 Shamrock St NE
- 130 Meadow Ave NE
- 102 Snyder Ct NE
- 94 Snyder Ct NE
- 87 Edgewood Ave NE
- 75 Wilson St NE
- 274 Hatley Cir NE
- 00000 Mckinnon Ave NE
- 47 Edgewood Ave NE Unit B-8
- 233 Jefferson Ave NE
- 237 Jefferson Ave NE
- 59 Mckinnon Ave NE
- 13 Adams St NE
- 145 Saint Charles Ave NE
- 247 Cabarrus Ave E
- 336 Hamilton Dr NE
- 372 Aycock St NE
- 83 Woodsdale Place SE
- 159 Madison Ave NE
- 1 Buffalo Ave NW Unit 81
- 151 May St NE
- 165 May St NE
- 145 May St NE
- 145 May St NE Unit 20
- 171 May St NE
- 139 May St NE
- 0000 May St NE
- 175 May St NE
- 123 Shamrock St NE
- 179 May St NE
- 154 Shamrock St NE
- 115 Shamrock St NE
- 144 Shamrock St NE
- 158 Shamrock St NE
- 136 Shamrock St NE
- 165 Shamrock St NE
- 109 Shamrock St NE
- 140 Meadow Ave NE
- 144 Meadow Ave NE
- 128 Shamrock St NE
Your Personal Tour Guide
Ask me questions while you tour the home.