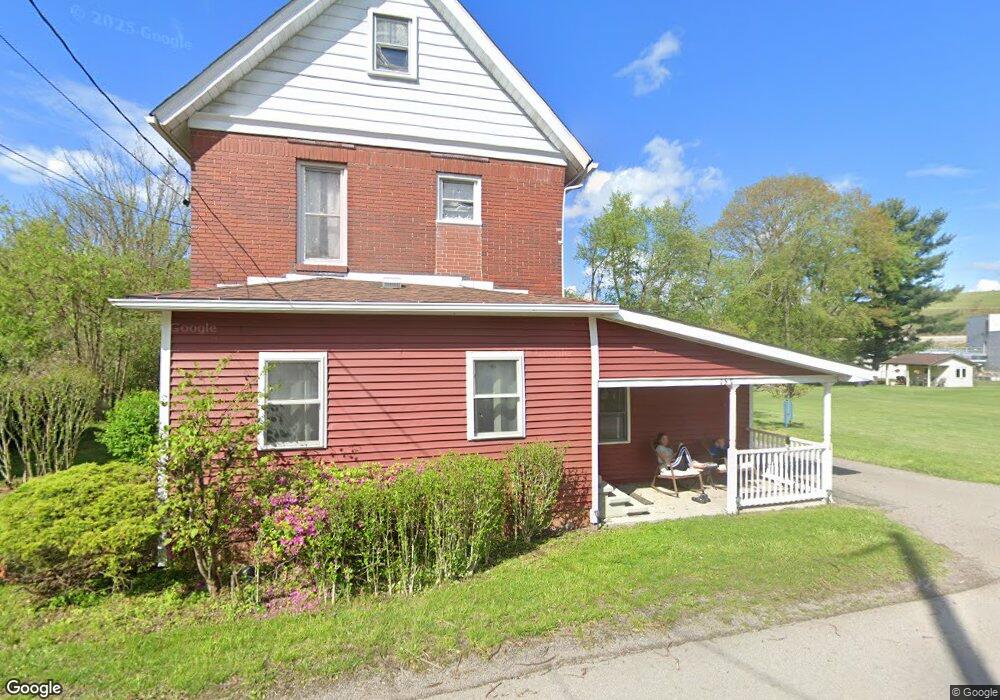
157 Mazza St Homer City, PA 15748
Estimated Value: $116,000 - $151,532
3
Beds
1
Bath
1,724
Sq Ft
$80/Sq Ft
Est. Value
About This Home
This home is located at 157 Mazza St, Homer City, PA 15748 and is currently estimated at $138,383, approximately $80 per square foot. 157 Mazza St is a home located in Indiana County with nearby schools including Homer-Center Elementary School and Homer-Center Junior/Senior High School.
Ownership History
Date
Name
Owned For
Owner Type
Purchase Details
Closed on
Dec 12, 2018
Sold by
Williams Arthur E and Estate Of Mar O Oaks
Bought by
Cobra Holdings Llc
Current Estimated Value
Home Financials for this Owner
Home Financials are based on the most recent Mortgage that was taken out on this home.
Original Mortgage
$56,000
Outstanding Balance
$49,337
Interest Rate
4.8%
Mortgage Type
Commercial
Estimated Equity
$89,046
Purchase Details
Closed on
Feb 23, 2011
Sold by
Williams Arthur E
Bought by
Oaks Mary G
Purchase Details
Closed on
Jul 28, 2009
Sold by
Halsey Richard E
Bought by
Williams Arthur E
Create a Home Valuation Report for This Property
The Home Valuation Report is an in-depth analysis detailing your home's value as well as a comparison with similar homes in the area
Home Values in the Area
Average Home Value in this Area
Purchase History
| Date | Buyer | Sale Price | Title Company |
|---|---|---|---|
| Cobra Holdings Llc | $70,000 | None Available | |
| Oaks Mary G | -- | None Available | |
| Williams Arthur E | $153,000 | None Available |
Source: Public Records
Mortgage History
| Date | Status | Borrower | Loan Amount |
|---|---|---|---|
| Open | Cobra Holdings Llc | $56,000 |
Source: Public Records
Tax History Compared to Growth
Tax History
| Year | Tax Paid | Tax Assessment Tax Assessment Total Assessment is a certain percentage of the fair market value that is determined by local assessors to be the total taxable value of land and additions on the property. | Land | Improvement |
|---|---|---|---|---|
| 2025 | $2,391 | $85,000 | $14,700 | $70,300 |
| 2024 | $2,357 | $85,000 | $14,700 | $70,300 |
| 2023 | $2,232 | $85,000 | $14,700 | $70,300 |
| 2022 | $2,132 | $85,000 | $14,700 | $70,300 |
| 2021 | $2,132 | $85,000 | $14,700 | $70,300 |
| 2020 | $2,093 | $85,000 | $14,700 | $70,300 |
| 2018 | $2,596 | $106,000 | $14,700 | $91,300 |
| 2017 | $2,608 | $106,000 | $14,700 | $91,300 |
| 2016 | -- | $106,000 | $14,700 | $91,300 |
| 2015 | -- | $16,290 | $2,030 | $14,260 |
| 2014 | -- | $16,290 | $2,030 | $14,260 |
Source: Public Records
Map
Nearby Homes