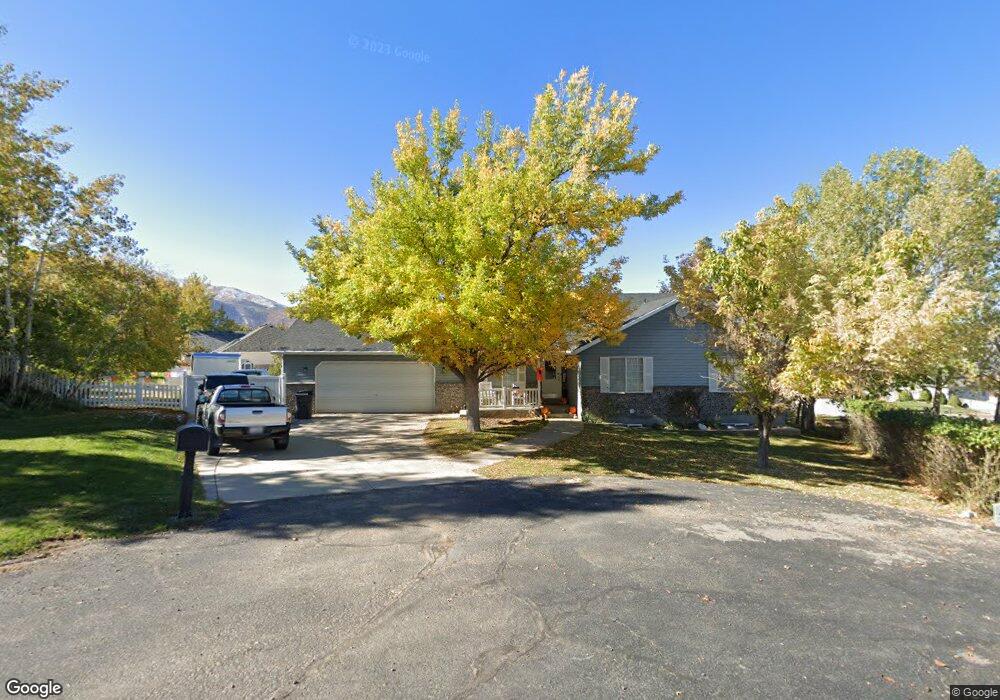
157 N Clark Ln Payson, UT 84651
Estimated Value: $628,000 - $638,000
5
Beds
3
Baths
3,857
Sq Ft
$165/Sq Ft
Est. Value
About This Home
This home is located at 157 N Clark Ln, Payson, UT 84651 and is currently estimated at $634,592, approximately $164 per square foot. 157 N Clark Ln is a home located in Utah County with nearby schools including Foothills Elementary School, Valley View Middle School, and Salem Junior High School.
Ownership History
Date
Name
Owned For
Owner Type
Purchase Details
Closed on
Aug 16, 2018
Sold by
Crombie William and The Crombie Family Trust
Bought by
Hanna Levi
Current Estimated Value
Home Financials for this Owner
Home Financials are based on the most recent Mortgage that was taken out on this home.
Original Mortgage
$288,000
Outstanding Balance
$250,116
Interest Rate
4.5%
Mortgage Type
New Conventional
Estimated Equity
$384,476
Purchase Details
Closed on
Mar 26, 2016
Sold by
Crombie William G
Bought by
Crombie William and Crombie Family Trust
Home Financials for this Owner
Home Financials are based on the most recent Mortgage that was taken out on this home.
Original Mortgage
$253,536
Interest Rate
3.65%
Mortgage Type
VA
Purchase Details
Closed on
Jul 1, 2014
Sold by
Crombie William
Bought by
Crombie William and Crombie Family Trust
Create a Home Valuation Report for This Property
The Home Valuation Report is an in-depth analysis detailing your home's value as well as a comparison with similar homes in the area
Home Values in the Area
Average Home Value in this Area
Purchase History
| Date | Buyer | Sale Price | Title Company |
|---|---|---|---|
| Hanna Levi | -- | Gt Title Services | |
| Crombie William | -- | Old Republic Title Orem | |
| Crombie William G | -- | Old Republic Title | |
| Crombie William | -- | None Available |
Source: Public Records
Mortgage History
| Date | Status | Borrower | Loan Amount |
|---|---|---|---|
| Open | Hanna Levi | $288,000 | |
| Previous Owner | Crombie William G | $253,536 |
Source: Public Records
Tax History Compared to Growth
Tax History
| Year | Tax Paid | Tax Assessment Tax Assessment Total Assessment is a certain percentage of the fair market value that is determined by local assessors to be the total taxable value of land and additions on the property. | Land | Improvement |
|---|---|---|---|---|
| 2025 | $2,923 | $318,340 | $182,300 | $396,500 |
| 2024 | $2,923 | $300,355 | $0 | $0 |
| 2023 | $2,940 | $302,830 | $0 | $0 |
| 2022 | $2,955 | $299,640 | $0 | $0 |
| 2021 | $2,513 | $394,000 | $120,800 | $273,200 |
| 2020 | $2,405 | $365,900 | $100,700 | $265,200 |
| 2019 | $2,264 | $351,100 | $100,700 | $250,400 |
| 2018 | $2,250 | $334,100 | $98,300 | $235,800 |
| 2017 | $2,051 | $162,580 | $0 | $0 |
| 2016 | $1,945 | $150,480 | $0 | $0 |
| 2015 | $1,807 | $137,060 | $0 | $0 |
| 2014 | $1,688 | $128,700 | $0 | $0 |
Source: Public Records
Map
Nearby Homes
- 300 E Magellan Ln
- 93 E Park Dr
- 359 E Magellan Ln N
- 51 E Magellan Ln
- 181 N Powell Rd
- 183 Ama Fille Ln N
- 650 E Bridger Ln
- 94 W Hillside Dr
- 142 W Parkside Loop
- 85 N Parkside Loop
- 617 E Longview Dr Unit 7
- 555 E Longview Dr Unit 30
- 591 E Longview Dr Unit 6
- Streamer Plan at Elk Ridge
- Collet Plan at Elk Ridge
- Evans Plan at Elk Ridge
- Fairbanks Plan at Elk Ridge
- Chelser Plan at Elk Ridge
- 607 N Mountain View Dr
- 135 W Cove Dr