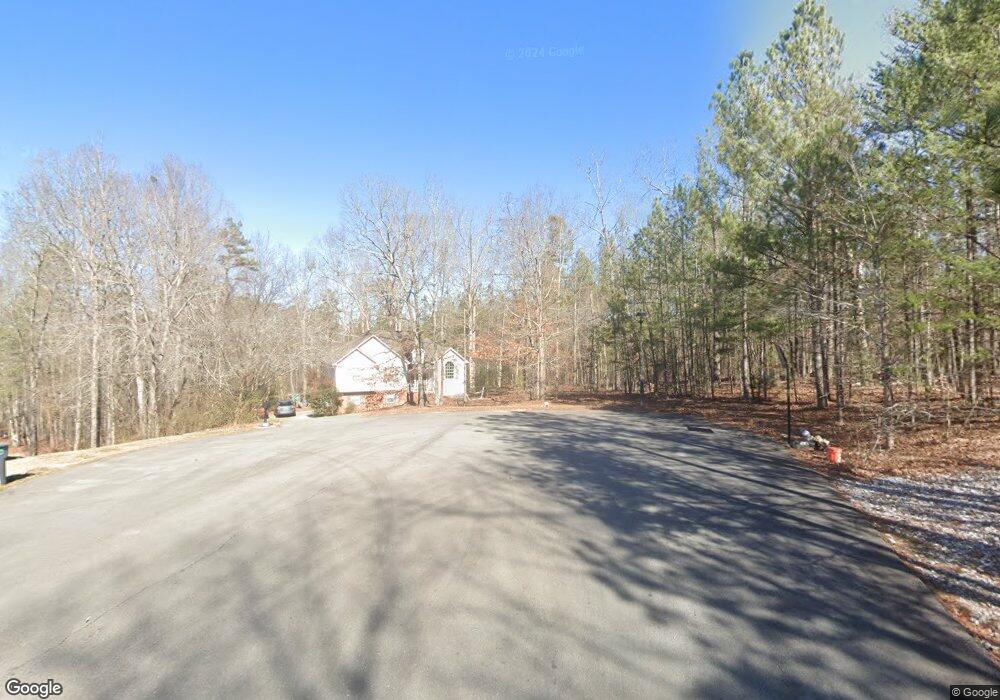
157 Pond Mill Ct SE Silver Creek, GA 30173
Estimated Value: $289,548 - $400,000
--
Bed
--
Bath
1,604
Sq Ft
$225/Sq Ft
Est. Value
About This Home
This home is located at 157 Pond Mill Ct SE, Silver Creek, GA 30173 and is currently estimated at $361,637, approximately $225 per square foot. 157 Pond Mill Ct SE is a home located in Floyd County with nearby schools including Pepperell Middle School and Pepperell High School.
Ownership History
Date
Name
Owned For
Owner Type
Purchase Details
Closed on
Jan 13, 2006
Sold by
Not Provided
Bought by
Arrington Larry Dex and Arrington Christina J
Current Estimated Value
Home Financials for this Owner
Home Financials are based on the most recent Mortgage that was taken out on this home.
Original Mortgage
$172,591
Outstanding Balance
$95,546
Interest Rate
6.21%
Mortgage Type
FHA
Estimated Equity
$266,091
Purchase Details
Closed on
Oct 20, 1999
Sold by
Parks Timothy M
Bought by
Dickinson James R and Dick Michelle L
Purchase Details
Closed on
Jun 17, 1999
Sold by
Sorrells David Scott and Sorrells Brenda L
Bought by
Parks Timothy M
Purchase Details
Closed on
Feb 2, 1999
Sold by
Lewis Freddie
Bought by
Sorrells David Scott and Sorrells Brenda L
Purchase Details
Closed on
Aug 5, 1998
Sold by
Stephens Stanley
Bought by
Lewis Freddie
Purchase Details
Closed on
Mar 27, 1995
Bought by
Stephens Stanley
Create a Home Valuation Report for This Property
The Home Valuation Report is an in-depth analysis detailing your home's value as well as a comparison with similar homes in the area
Home Values in the Area
Average Home Value in this Area
Purchase History
| Date | Buyer | Sale Price | Title Company |
|---|---|---|---|
| Arrington Larry Dex | $175,300 | -- | |
| Dickinson James R | $129,900 | -- | |
| Parks Timothy M | $15,900 | -- | |
| Sorrells David Scott | $13,500 | -- | |
| Lewis Freddie | $285,000 | -- | |
| Stephens Stanley | -- | -- |
Source: Public Records
Mortgage History
| Date | Status | Borrower | Loan Amount |
|---|---|---|---|
| Open | Arrington Larry Dex | $172,591 |
Source: Public Records
Tax History Compared to Growth
Tax History
| Year | Tax Paid | Tax Assessment Tax Assessment Total Assessment is a certain percentage of the fair market value that is determined by local assessors to be the total taxable value of land and additions on the property. | Land | Improvement |
|---|---|---|---|---|
| 2024 | $3,442 | $111,332 | $10,500 | $100,832 |
| 2023 | $3,253 | $94,388 | $10,500 | $83,888 |
| 2022 | $2,514 | $82,389 | $10,000 | $72,389 |
| 2021 | $2,388 | $76,902 | $10,000 | $66,902 |
| 2020 | $2,331 | $74,497 | $10,000 | $64,497 |
| 2019 | $2,110 | $68,272 | $10,000 | $58,272 |
| 2018 | $2,038 | $65,828 | $10,000 | $55,828 |
| 2017 | $1,963 | $63,198 | $10,000 | $53,198 |
| 2016 | $1,967 | $62,560 | $10,000 | $52,560 |
| 2015 | $1,955 | $63,200 | $10,000 | $53,200 |
| 2014 | $1,955 | $63,523 | $10,000 | $53,523 |
Source: Public Records
Map
Nearby Homes
- 6792 Rockmart Rd SE
- 0 Hwy 101 and Dean Rd Unit 10620814
- 838 Pleasant Hope Rd SE
- 1424 Harmony Rd SE
- 150 Pleasant Hope Rd SE
- 463 Compton Rd SE
- 1104 Burkhalter Rd SE
- 0 Stewart Rd
- 4526 Rome Hwy
- 1062 Bethel Church Rd SE
- 5712 Rockmart Rd SE
- 231 Gordon Rd
- 850 Bethel Church Rd SE
- 110 Williams Rd SE
- 565 Raiford Rd
- 52 Lloyd Dr SE
- 2557 Wax Rd SE
- 1111 Old Collard Valley Rd
- 573 Relay Rd SE
- 894 Wax Rd SE
- 151 Pond Mill Ct SE
- 140 Pond Mill Ct SE
- 127 Pond Mill Ct SE
- 124 Pond Mill Ct SE
- 124 Pond Mill Ct SE
- 93 Pond Mill Ct SE
- 91 Pond Mill Ct SE
- 90 Pond Mill Ct SE
- 88 Pond Mill Ct SE
- 0 Pond Mill Ct SE Unit Lot 36 8544718
- 0 Pond Mill Ct SE Unit 8230038
- 57 Pond Mill Ct SE
- 66 Pond Mill Ct SE
- 156 Windmill Dr SE
- 35 Pond Mill Ct SE
- 23 Pond Mill Ct SE
- 142 Windmill Dr SE
- 34 Pond Mill Ct SE
- 42 Pond Mill Ct SE
- 22 Pond Mill Ct SE