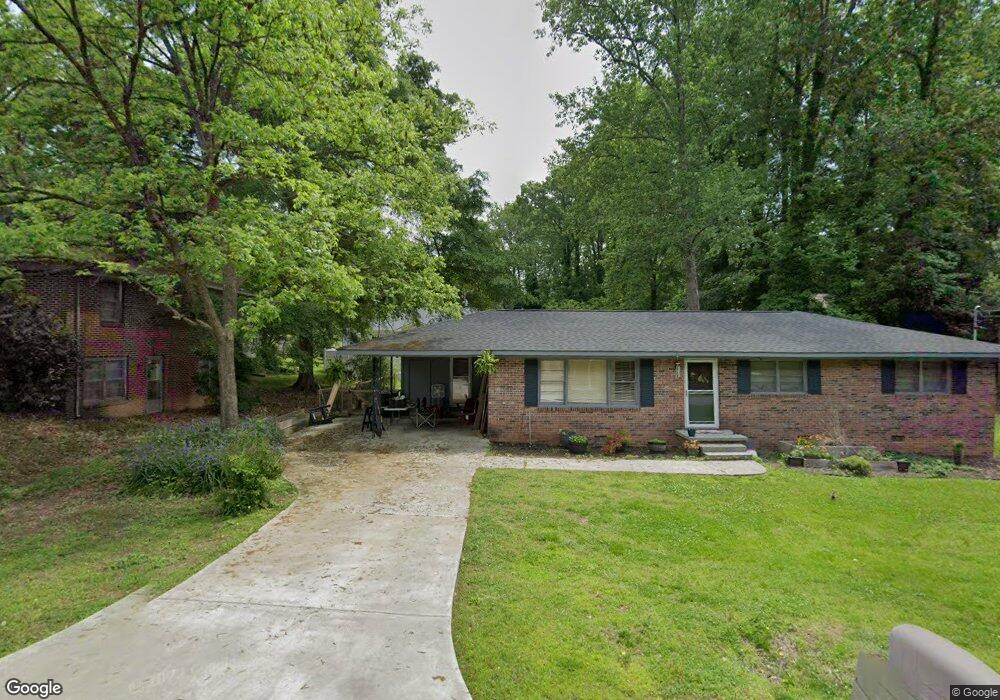
157 Poplar St Toccoa, GA 30577
Estimated Value: $131,000 - $202,000
3
Beds
2
Baths
1,368
Sq Ft
$121/Sq Ft
Est. Value
About This Home
This home is located at 157 Poplar St, Toccoa, GA 30577 and is currently estimated at $165,769, approximately $121 per square foot. 157 Poplar St is a home located in Stephens County with nearby schools including Stephens County High School.
Ownership History
Date
Name
Owned For
Owner Type
Purchase Details
Closed on
Dec 21, 2020
Sold by
Franklin Dorsey
Bought by
Reiger Joshua James and Reiger Tori Lynell
Current Estimated Value
Home Financials for this Owner
Home Financials are based on the most recent Mortgage that was taken out on this home.
Original Mortgage
$77,600
Outstanding Balance
$69,087
Interest Rate
2.7%
Mortgage Type
New Conventional
Estimated Equity
$96,682
Purchase Details
Closed on
May 17, 2012
Sold by
Us Bank National Associati
Bought by
Docsol Deland
Purchase Details
Closed on
Mar 6, 2012
Sold by
Hunt Jennifer
Bought by
Us Bank National Association T
Purchase Details
Closed on
May 22, 2006
Sold by
Lange Erwin
Bought by
Hunt Jennifer and Hunt Kenneth
Purchase Details
Closed on
Dec 18, 2003
Bought by
<Buyer Info Not Present>
Purchase Details
Closed on
Mar 1, 1995
Bought by
Franklin Dorsey
Purchase Details
Closed on
Jun 1, 1989
Bought by
<Buyer Info Not Present>
Create a Home Valuation Report for This Property
The Home Valuation Report is an in-depth analysis detailing your home's value as well as a comparison with similar homes in the area
Home Values in the Area
Average Home Value in this Area
Purchase History
| Date | Buyer | Sale Price | Title Company |
|---|---|---|---|
| Reiger Joshua James | $80,000 | -- | |
| Docsol Deland | $37,199 | -- | |
| Us Bank National Association T | $42,000 | -- | |
| Hunt Jennifer | $93,100 | -- | |
| <Buyer Info Not Present> | -- | -- | |
| Franklin Dorsey | $45,000 | -- | |
| <Buyer Info Not Present> | $39,000 | -- |
Source: Public Records
Mortgage History
| Date | Status | Borrower | Loan Amount |
|---|---|---|---|
| Open | Reiger Joshua James | $77,600 |
Source: Public Records
Tax History Compared to Growth
Tax History
| Year | Tax Paid | Tax Assessment Tax Assessment Total Assessment is a certain percentage of the fair market value that is determined by local assessors to be the total taxable value of land and additions on the property. | Land | Improvement |
|---|---|---|---|---|
| 2024 | $1,151 | $34,000 | $2,002 | $31,998 |
| 2023 | $1,055 | $31,500 | $2,002 | $29,498 |
| 2022 | $825 | $29,719 | $2,002 | $27,717 |
| 2021 | $705 | $24,551 | $2,002 | $22,549 |
| 2020 | $760 | $24,078 | $2,002 | $22,076 |
| 2019 | $764 | $24,078 | $2,002 | $22,076 |
| 2018 | $764 | $24,078 | $2,002 | $22,076 |
| 2017 | $778 | $24,138 | $2,002 | $22,136 |
| 2016 | $765 | $24,138 | $2,002 | $22,136 |
| 2015 | $788 | $23,736 | $2,002 | $21,734 |
| 2014 | $801 | $23,736 | $2,002 | $21,734 |
| 2013 | -- | $24,170 | $2,002 | $22,168 |
Source: Public Records
Map
Nearby Homes
- 226 Poplar St
- 253 Stancil Dr
- 229 Hilltop Ln
- 278 Stancil Dr
- 59 Sunset Ln
- 294 Stancil Dr
- 0 Valley Dr Unit 7675761
- 0 Valley Dr Unit 10600268
- 30 Moore Ave
- 739 Poplar St
- 128 Branch St
- 614 616 S Pond St
- 943 S Pond St
- 249 S Hill St
- 574 S Sage St
- 0 Hwy 17 Alt Unit 10577119
- 1009 S Pond St
- 1037 S Pond St
- 11 Cloverhurst Dr
- 17 Taylor St