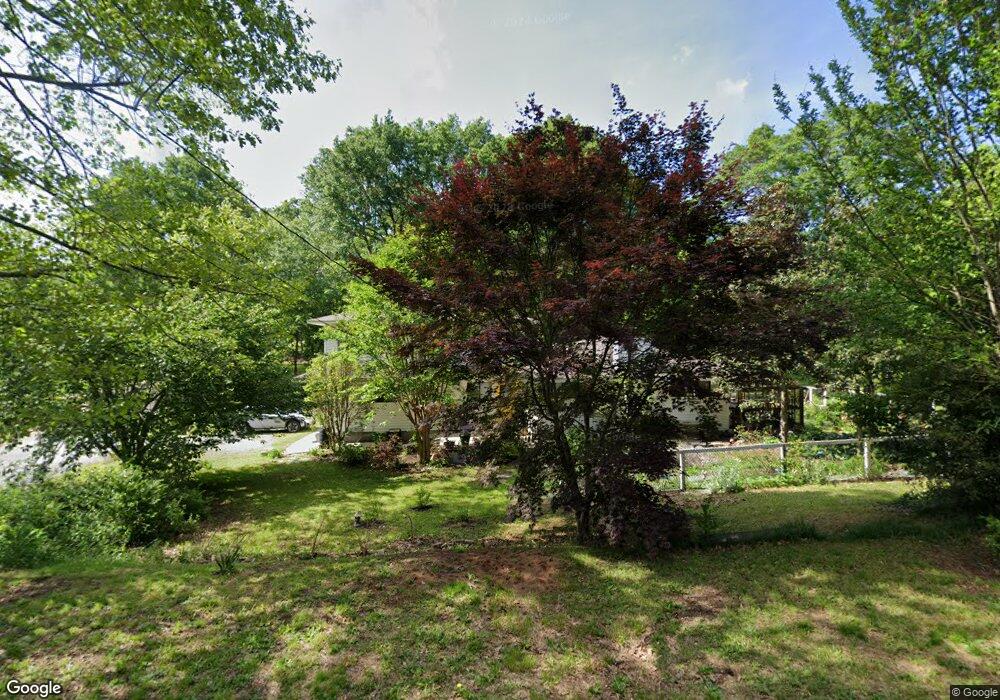
157 Spring St Unit 1 Clarkesville, GA 30523
Estimated Value: $322,000 - $477,000
3
Beds
3
Baths
2,034
Sq Ft
$194/Sq Ft
Est. Value
About This Home
This home is located at 157 Spring St Unit 1, Clarkesville, GA 30523 and is currently estimated at $394,119, approximately $193 per square foot. 157 Spring St Unit 1 is a home located in Habersham County with nearby schools including Clarkesville Elementary School, North Habersham Middle School, and Habersham Success Academy.
Ownership History
Date
Name
Owned For
Owner Type
Purchase Details
Closed on
Aug 15, 2016
Sold by
Jean Nancy
Bought by
Menninger Nancy Jean
Current Estimated Value
Purchase Details
Closed on
Jul 31, 2015
Sold by
Michael Douglas C
Bought by
Allen H Jonathan
Home Financials for this Owner
Home Financials are based on the most recent Mortgage that was taken out on this home.
Original Mortgage
$72,500
Interest Rate
4.11%
Mortgage Type
New Conventional
Purchase Details
Closed on
Nov 1, 2007
Sold by
Not Provided
Bought by
Michael Douglas
Home Financials for this Owner
Home Financials are based on the most recent Mortgage that was taken out on this home.
Original Mortgage
$105,000
Interest Rate
6.22%
Mortgage Type
New Conventional
Create a Home Valuation Report for This Property
The Home Valuation Report is an in-depth analysis detailing your home's value as well as a comparison with similar homes in the area
Home Values in the Area
Average Home Value in this Area
Purchase History
| Date | Buyer | Sale Price | Title Company |
|---|---|---|---|
| Menninger Nancy Jean | -- | -- | |
| Sprouse Nancy Jean | $162,000 | -- | |
| Allen H Jonathan | $75,500 | -- | |
| Michael Douglas | $140,000 | -- |
Source: Public Records
Mortgage History
| Date | Status | Borrower | Loan Amount |
|---|---|---|---|
| Previous Owner | Allen H Jonathan | $72,500 | |
| Previous Owner | Michael Douglas | $105,000 |
Source: Public Records
Tax History
| Year | Tax Paid | Tax Assessment Tax Assessment Total Assessment is a certain percentage of the fair market value that is determined by local assessors to be the total taxable value of land and additions on the property. | Land | Improvement |
|---|---|---|---|---|
| 2025 | $2,611 | $145,344 | $20,000 | $125,344 |
| 2024 | -- | $161,700 | $10,000 | $151,700 |
| 2023 | $659 | $163,408 | $10,000 | $153,408 |
| 2022 | $2,081 | $100,464 | $10,000 | $90,464 |
| 2021 | $1,901 | $84,968 | $10,000 | $74,968 |
| 2020 | $1,824 | $74,348 | $10,000 | $64,348 |
| 2019 | $1,826 | $74,348 | $10,000 | $64,348 |
| 2018 | $1,786 | $72,348 | $8,000 | $64,348 |
| 2017 | $1,676 | $64,336 | $6,000 | $58,336 |
| 2016 | $1,395 | $133,790 | $6,000 | $47,516 |
| 2015 | $1,328 | $128,790 | $4,000 | $47,516 |
| 2014 | $1,318 | $125,520 | $4,000 | $46,208 |
| 2013 | -- | $47,424 | $4,000 | $43,424 |
Source: Public Records
Map
Nearby Homes
- 152 Russ Cir
- 643 Washington St
- 620 Washington St
- 671 Washington St
- 745 Washington St
- 148 Village Dr
- 1&2 Village Dr
- 153 View St
- 169 View St
- 135 Village Dr
- 205 Flesner Ct
- 253 Lacount Ln
- 111 Smith Ct
- 172 Llewellyn St
- 395 E Louise St
- 0 Ivy Ridge Way Unit LOT 40 10327774
- 0 Ivy Ridge Way Unit LOT 6 10487513
- 0 Ivy Ridge Way Unit LOT 50 10487398
- 260 Bartley Wilbanks Rd
- 112 Woodland St
- 157 Spring St
- 153 Russ Cir Unit 2
- 153 Russ Cir
- 137 Spring St
- 0 Russ Cir Unit 10366178
- 0 Russ Cir Unit 7 9023093
- 601 Washington St
- 180 Russ Cir
- 617 Washington St
- 151 Russ Cir
- 188 Spring St
- 625 Washington St
- 595 Washington St
- 112 Spring St
- 587 Highway 197 N
- 214 Spring St
- 635 Washington St
- 147 Russ Cir
- 487 Washington St
- 142 Russ Cir Unit 6
Your Personal Tour Guide
Ask me questions while you tour the home.