157 State St Hanson, MA 02341
Estimated Value: $577,576 - $634,000
4
Beds
1
Bath
1,144
Sq Ft
$526/Sq Ft
Est. Value
About This Home
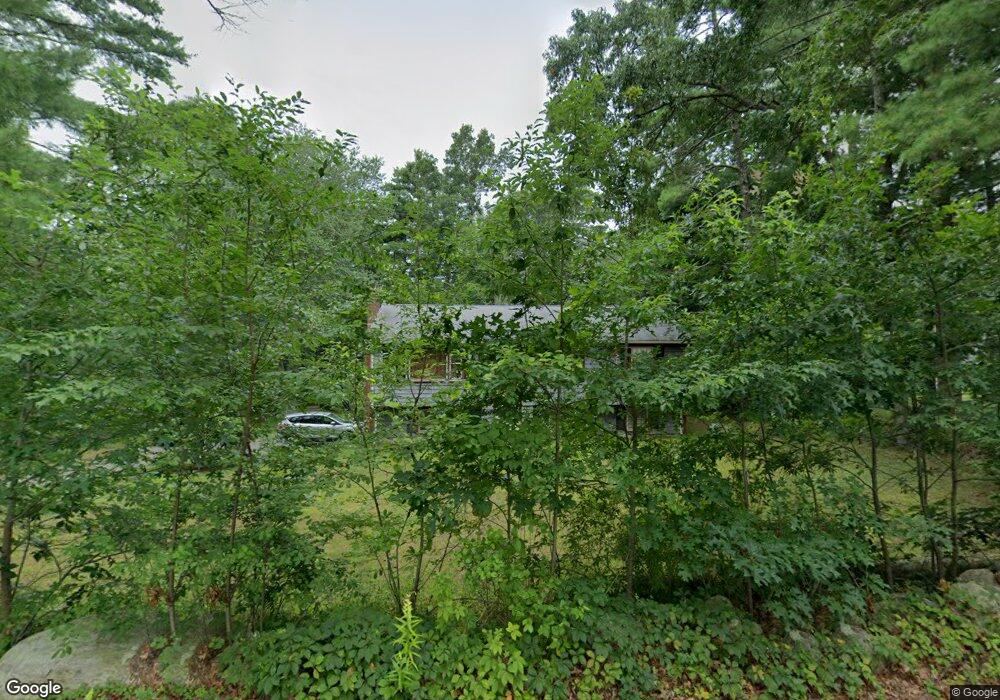
This home is located at 157 State St, Hanson, MA 02341 and is currently estimated at $601,894, approximately $526 per square foot. 157 State St is a home located in Plymouth County with nearby schools including Cadence Academy Preschool - Hanover and Cardinal Cushing Centers.
Ownership History
Date
Name
Owned For
Owner Type
Purchase Details
Closed on
Jul 1, 1998
Sold by
Curran Kenneth M and Curran Susan M
Bought by
Orlando Peter C and Orlando Patricia M
Current Estimated Value
Home Financials for this Owner
Home Financials are based on the most recent Mortgage that was taken out on this home.
Original Mortgage
$128,400
Outstanding Balance
$26,368
Interest Rate
7.04%
Mortgage Type
Purchase Money Mortgage
Estimated Equity
$575,526
Create a Home Valuation Report for This Property
The Home Valuation Report is an in-depth analysis detailing your home's value as well as a comparison with similar homes in the area
Home Values in the Area
Average Home Value in this Area
Purchase History
| Date | Buyer | Sale Price | Title Company |
|---|---|---|---|
| Orlando Peter C | $165,900 | -- |
Source: Public Records
Mortgage History
| Date | Status | Borrower | Loan Amount |
|---|---|---|---|
| Open | Orlando Peter C | $25,000 | |
| Open | Orlando Peter C | $128,400 | |
| Previous Owner | Orlando Peter C | $20,000 | |
| Previous Owner | Orlando Peter C | $97,000 |
Source: Public Records
Tax History
| Year | Tax Paid | Tax Assessment Tax Assessment Total Assessment is a certain percentage of the fair market value that is determined by local assessors to be the total taxable value of land and additions on the property. | Land | Improvement |
|---|---|---|---|---|
| 2025 | $6,005 | $448,800 | $190,100 | $258,700 |
| 2024 | $5,881 | $439,500 | $184,600 | $254,900 |
| 2023 | $5,763 | $406,400 | $184,600 | $221,800 |
| 2022 | $5,621 | $372,500 | $167,800 | $204,700 |
| 2021 | $5,099 | $337,700 | $161,400 | $176,300 |
| 2020 | $4,983 | $326,300 | $155,900 | $170,400 |
| 2019 | $4,816 | $310,100 | $152,900 | $157,200 |
| 2018 | $4,733 | $299,000 | $147,000 | $152,000 |
| 2017 | $4,583 | $286,800 | $140,000 | $146,800 |
| 2016 | $4,642 | $280,500 | $140,000 | $140,500 |
| 2015 | $4,410 | $277,000 | $140,000 | $137,000 |
Source: Public Records
Map
Nearby Homes
- 339 State St
- 430 Brook Bend Rd
- 269 Lakeside Rd
- 127 Crescent Place
- 134 Crescent St
- 51 Farmside Dr
- 7 Farmside Dr
- 285 W Elm St
- 26 Stonebridge Dr
- 139 Fairwood Dr
- 161 Winter St Unit 11
- 108 Waterford Dr
- 114 Graham Hill Dr
- 66 Wildwood Rd
- 60 Summer Path Way
- 84 Liberty St
- 35 Sproul Rd
- Lot 6 Way
- Lot 5 Princeton Way
- 7 Andrew Dr
Your Personal Tour Guide
Ask me questions while you tour the home.