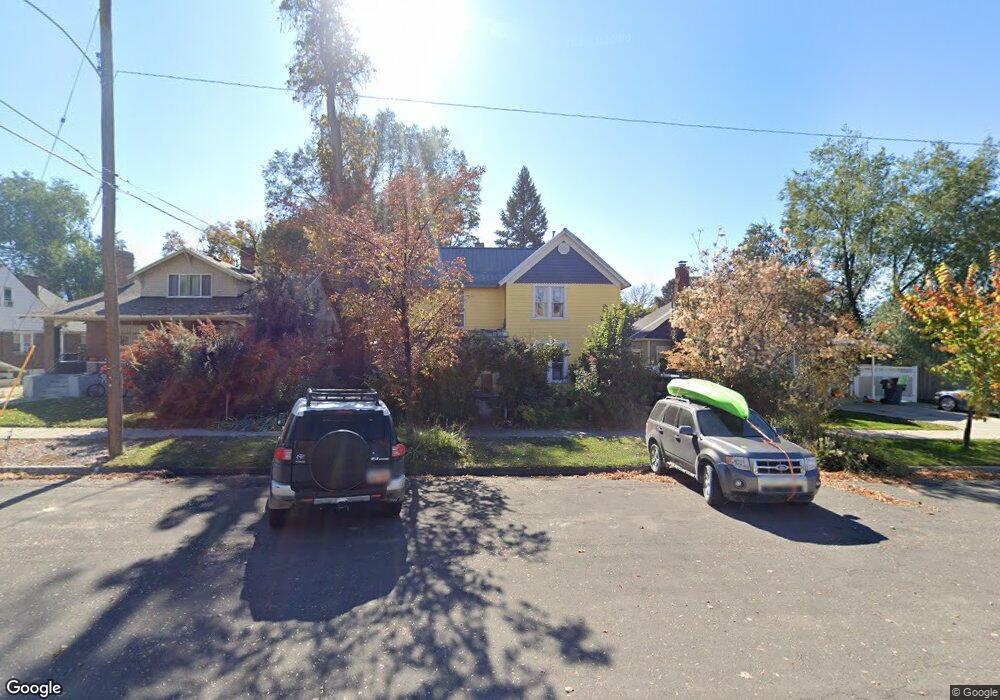
157 W 200 S Springville, UT 84663
Estimated Value: $408,000 - $459,000
4
Beds
2
Baths
2,025
Sq Ft
$212/Sq Ft
Est. Value
About This Home
This home is located at 157 W 200 S, Springville, UT 84663 and is currently estimated at $428,971, approximately $211 per square foot. 157 W 200 S is a home located in Utah County with nearby schools including Westside Elementary School, Springville Junior High School, and Springville High School.
Ownership History
Date
Name
Owned For
Owner Type
Purchase Details
Closed on
Dec 17, 2004
Sold by
Webb David B
Bought by
Webb David B and Webb Robyn G
Current Estimated Value
Home Financials for this Owner
Home Financials are based on the most recent Mortgage that was taken out on this home.
Original Mortgage
$126,900
Outstanding Balance
$63,679
Interest Rate
5.76%
Mortgage Type
New Conventional
Estimated Equity
$365,292
Purchase Details
Closed on
Dec 14, 2000
Sold by
Conover Martin W
Bought by
Webb David B and Webb Robyn G
Home Financials for this Owner
Home Financials are based on the most recent Mortgage that was taken out on this home.
Original Mortgage
$98,600
Interest Rate
7.81%
Create a Home Valuation Report for This Property
The Home Valuation Report is an in-depth analysis detailing your home's value as well as a comparison with similar homes in the area
Home Values in the Area
Average Home Value in this Area
Purchase History
| Date | Buyer | Sale Price | Title Company |
|---|---|---|---|
| Webb David B | -- | Horizon Title | |
| Webb David B | -- | Horizon Title | |
| Webb David B | -- | Inwest Title Services Inc |
Source: Public Records
Mortgage History
| Date | Status | Borrower | Loan Amount |
|---|---|---|---|
| Open | Webb David B | $126,900 | |
| Closed | Webb David B | $98,600 |
Source: Public Records
Tax History
| Year | Tax Paid | Tax Assessment Tax Assessment Total Assessment is a certain percentage of the fair market value that is determined by local assessors to be the total taxable value of land and additions on the property. | Land | Improvement |
|---|---|---|---|---|
| 2025 | $1,841 | $200,255 | -- | -- |
| 2024 | $1,841 | $188,595 | $0 | $0 |
| 2023 | $1,837 | $188,430 | $0 | $0 |
| 2022 | $1,864 | $187,715 | $0 | $0 |
| 2021 | $1,674 | $262,500 | $88,900 | $173,600 |
| 2020 | $1,542 | $234,400 | $74,100 | $160,300 |
| 2019 | $1,366 | $211,400 | $70,600 | $140,800 |
| 2018 | $1,386 | $204,600 | $63,800 | $140,800 |
| 2017 | $1,268 | $99,385 | $0 | $0 |
| 2016 | $1,098 | $84,425 | $0 | $0 |
| 2015 | $1,047 | $82,280 | $0 | $0 |
| 2014 | $1,054 | $82,280 | $0 | $0 |
Source: Public Records
Map
Nearby Homes
- 171 W 200 S
- 311 W Center St
- 383 W 100 S
- 393 W Center St
- 110 S 200 E
- 72 E 400 S
- 147 N 100 E
- 231 N 100 W
- 30 N 200 E
- 572 S 100 W Unit E 210
- 550 S 400 W
- 64 W 600 S Unit C301
- 64 W 600 S Unit C205
- 64 W 600 S Unit C206
- 67 W 600 S Unit B301
- 618 S 100 W Unit 302
- 618 S 100 W Unit D102
- 58 W 300 N
- 511 W 300 S Unit A
- 234 W 700 S
Your Personal Tour Guide
Ask me questions while you tour the home.