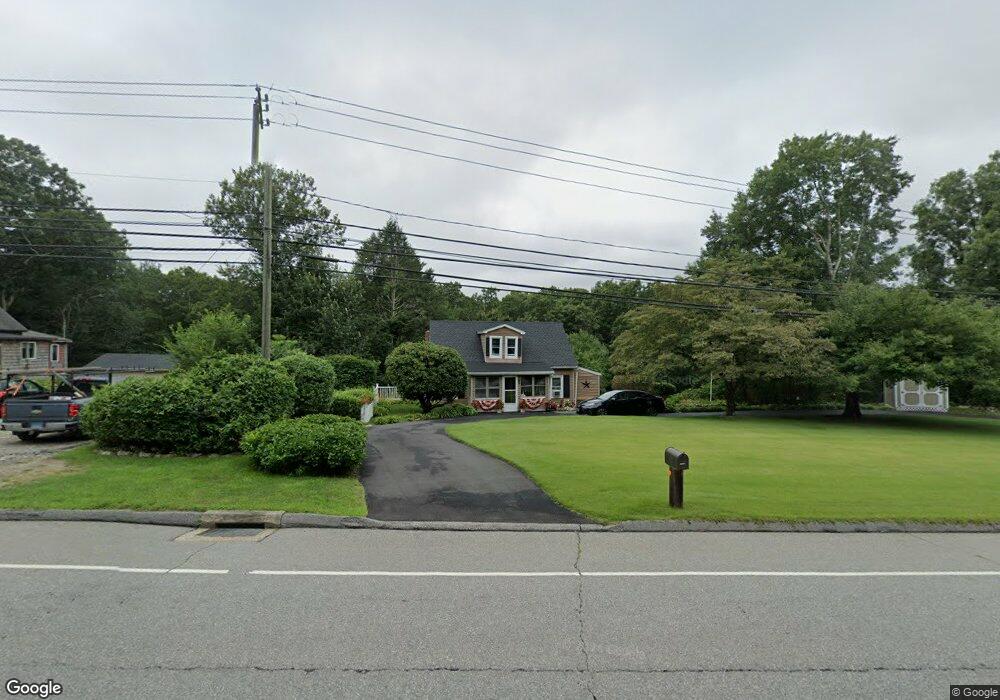
157 Wauregan Rd Danielson, CT 06239
Estimated Value: $264,000 - $305,000
2
Beds
1
Bath
1,163
Sq Ft
$248/Sq Ft
Est. Value
About This Home
This home is located at 157 Wauregan Rd, Danielson, CT 06239 and is currently estimated at $288,955, approximately $248 per square foot. 157 Wauregan Rd is a home located in Windham County with nearby schools including Killingly Central School, Killingly Memorial School, and Killingly Intermediate School.
Ownership History
Date
Name
Owned For
Owner Type
Purchase Details
Closed on
May 6, 2002
Sold by
Lucas Patrick G and Lucas Lori
Bought by
Polli John
Current Estimated Value
Purchase Details
Closed on
Sep 26, 2001
Sold by
Rioux Roger A and Rioux Desiree
Bought by
Lucas Patrick G and Lucas Lori
Purchase Details
Closed on
Jun 16, 1999
Sold by
First Union Natl Bk
Bought by
Rioux Roger A and Rioux Desiree
Create a Home Valuation Report for This Property
The Home Valuation Report is an in-depth analysis detailing your home's value as well as a comparison with similar homes in the area
Home Values in the Area
Average Home Value in this Area
Purchase History
| Date | Buyer | Sale Price | Title Company |
|---|---|---|---|
| Polli John | $114,450 | -- | |
| Polli John | $114,450 | -- | |
| Lucas Patrick G | $60,000 | -- | |
| Lucas Patrick G | $60,000 | -- | |
| Rioux Roger A | $27,400 | -- | |
| Rioux Roger A | $27,400 | -- |
Source: Public Records
Mortgage History
| Date | Status | Borrower | Loan Amount |
|---|---|---|---|
| Open | Rioux Roger A | $94,350 | |
| Closed | Rioux Roger A | $115,000 |
Source: Public Records
Tax History
| Year | Tax Paid | Tax Assessment Tax Assessment Total Assessment is a certain percentage of the fair market value that is determined by local assessors to be the total taxable value of land and additions on the property. | Land | Improvement |
|---|---|---|---|---|
| 2025 | $3,302 | $151,240 | $34,970 | $116,270 |
| 2024 | $3,131 | $151,240 | $34,970 | $116,270 |
| 2023 | $3,205 | $117,040 | $28,700 | $88,340 |
| 2022 | $3,001 | $117,040 | $28,700 | $88,340 |
| 2021 | $3,001 | $117,040 | $28,700 | $88,340 |
| 2020 | $2,942 | $117,040 | $28,700 | $88,340 |
| 2019 | $2,980 | $117,040 | $28,700 | $88,340 |
| 2017 | $2,655 | $95,480 | $22,400 | $73,080 |
| 2016 | $2,585 | $92,960 | $22,400 | $70,560 |
| 2015 | $2,585 | $92,960 | $22,400 | $70,560 |
| 2014 | $2,511 | $92,960 | $22,400 | $70,560 |
Source: Public Records
Map
Nearby Homes
- 37 Cady St
- 43 Fall Brook Rd
- 20 Wauregan Rd
- 10 Cote Dr
- 18 Broad St
- 23 Tiffany St
- 147 South St
- 106 Water St
- 35 S Main St
- 85 Furnace St
- 53 S Main St
- 37 Katherine Ave
- 0 Providence Rd Unit 24080985
- 102 Cottage St
- 247 Green Hollow Rd
- 24 Center St
- 10 Center St
- 0 Allen Hill Rd Unit 24140370
- 37 Ruth St
- 73 Hawkins St
Your Personal Tour Guide
Ask me questions while you tour the home.