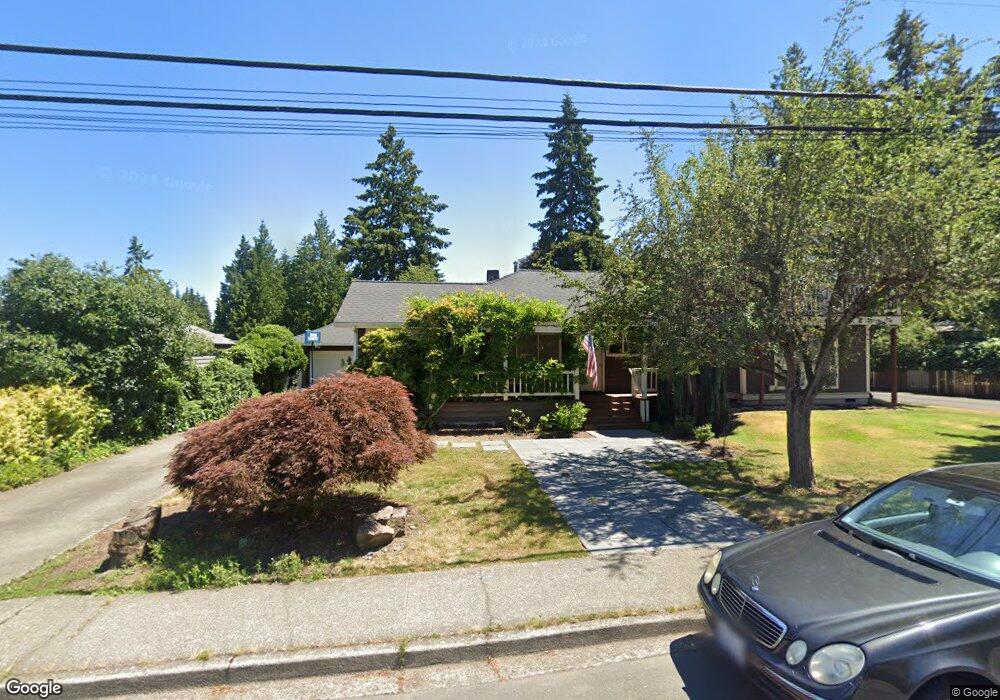
1570 3rd St Kirkland, WA 98033
Norkirk NeighborhoodEstimated Value: $1,897,000 - $2,329,000
3
Beds
2
Baths
2,560
Sq Ft
$860/Sq Ft
Est. Value
About This Home
This home is located at 1570 3rd St, Kirkland, WA 98033 and is currently estimated at $2,200,356, approximately $859 per square foot. 1570 3rd St is a home located in King County with nearby schools including Peter Kirk Elementary School, Kirkland Middle School, and Lake Washington High School.
Ownership History
Date
Name
Owned For
Owner Type
Purchase Details
Closed on
May 24, 2005
Sold by
Lamb Michael and Lamb Nanda L
Bought by
Shark Mark Brenner and Shark Annalisa
Current Estimated Value
Home Financials for this Owner
Home Financials are based on the most recent Mortgage that was taken out on this home.
Original Mortgage
$359,500
Outstanding Balance
$190,806
Interest Rate
6.12%
Mortgage Type
Fannie Mae Freddie Mac
Estimated Equity
$2,009,550
Create a Home Valuation Report for This Property
The Home Valuation Report is an in-depth analysis detailing your home's value as well as a comparison with similar homes in the area
Home Values in the Area
Average Home Value in this Area
Purchase History
| Date | Buyer | Sale Price | Title Company |
|---|---|---|---|
| Shark Mark Brenner | $450,000 | Chicago Title |
Source: Public Records
Mortgage History
| Date | Status | Borrower | Loan Amount |
|---|---|---|---|
| Open | Shark Mark Brenner | $359,500 | |
| Closed | Shark Mark Brenner | $68,000 |
Source: Public Records
Tax History Compared to Growth
Tax History
| Year | Tax Paid | Tax Assessment Tax Assessment Total Assessment is a certain percentage of the fair market value that is determined by local assessors to be the total taxable value of land and additions on the property. | Land | Improvement |
|---|---|---|---|---|
| 2024 | $15,902 | $1,965,000 | $1,205,000 | $760,000 |
| 2023 | $15,780 | $1,739,000 | $1,104,000 | $635,000 |
| 2022 | $13,072 | $2,097,000 | $1,334,000 | $763,000 |
| 2021 | $12,023 | $1,471,000 | $941,000 | $530,000 |
| 2020 | $11,869 | $1,243,000 | $809,000 | $434,000 |
| 2018 | $10,547 | $1,214,000 | $793,000 | $421,000 |
| 2017 | $9,159 | $1,040,000 | $712,000 | $328,000 |
| 2016 | $8,814 | $941,000 | $633,000 | $308,000 |
| 2015 | $8,016 | $894,000 | $593,000 | $301,000 |
| 2014 | -- | $782,000 | $564,000 | $218,000 |
| 2013 | -- | $643,000 | $513,000 | $130,000 |
Source: Public Records
Map
Nearby Homes