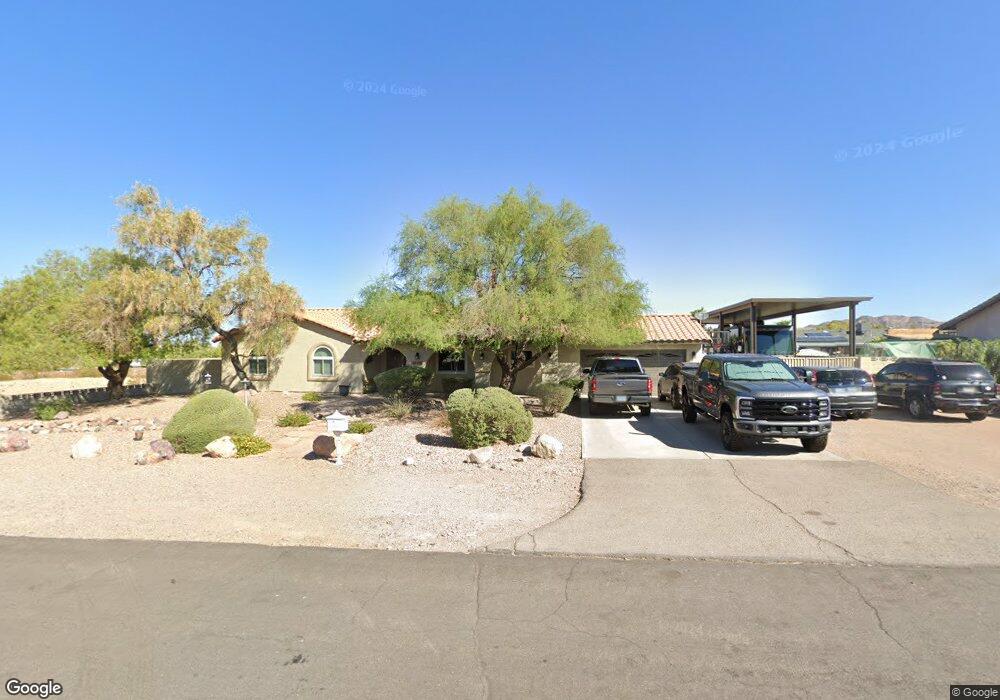
1570 Colt Dr Henderson, NV 89002
River Mountain NeighborhoodEstimated Value: $662,000 - $760,000
3
Beds
2
Baths
2,450
Sq Ft
$294/Sq Ft
Est. Value
About This Home
This home is located at 1570 Colt Dr, Henderson, NV 89002 and is currently estimated at $719,571, approximately $293 per square foot. 1570 Colt Dr is a home located in Clark County with nearby schools including John Dooley Elementary School, B Mahlon Brown Academy of International Studies, and Basic Academy of International Studies.
Ownership History
Date
Name
Owned For
Owner Type
Purchase Details
Closed on
Jul 28, 2023
Sold by
Huffmaster Douglas and Huffmaster Melisse
Bought by
Douglas And Melisse Huffmaster Revocable Fami and Huffmaster
Current Estimated Value
Purchase Details
Closed on
Jun 28, 2016
Sold by
Heimark Randy
Bought by
Heimark Nancy
Purchase Details
Closed on
Jan 29, 2000
Sold by
Schauss Melisse A and Schauss James E
Bought by
Huffmaster Douglas and Huffmaster Melisse
Purchase Details
Closed on
Mar 26, 1999
Sold by
Phelps Lynn O and Jill Phelps J
Bought by
Schauss James E and Schauss Constance L
Home Financials for this Owner
Home Financials are based on the most recent Mortgage that was taken out on this home.
Original Mortgage
$163,850
Interest Rate
6.73%
Create a Home Valuation Report for This Property
The Home Valuation Report is an in-depth analysis detailing your home's value as well as a comparison with similar homes in the area
Home Values in the Area
Average Home Value in this Area
Purchase History
| Date | Buyer | Sale Price | Title Company |
|---|---|---|---|
| Douglas And Melisse Huffmaster Revocable Fami | -- | None Listed On Document | |
| Heimark Nancy | -- | Equity Title Of Nevada | |
| Huffmaster Douglas | $172,500 | Fidelity National Title Ins | |
| Schauss James E | $172,500 | Nevada Title Company |
Source: Public Records
Mortgage History
| Date | Status | Borrower | Loan Amount |
|---|---|---|---|
| Previous Owner | Schauss James E | $163,850 |
Source: Public Records
Tax History Compared to Growth
Tax History
| Year | Tax Paid | Tax Assessment Tax Assessment Total Assessment is a certain percentage of the fair market value that is determined by local assessors to be the total taxable value of land and additions on the property. | Land | Improvement |
|---|---|---|---|---|
| 2025 | $3,630 | $169,444 | $49,000 | $120,444 |
| 2024 | $3,525 | $169,444 | $49,000 | $120,444 |
| 2023 | $3,525 | $165,635 | $52,500 | $113,135 |
| 2022 | $3,736 | $149,657 | $45,500 | $104,157 |
| 2021 | $3,459 | $133,988 | $35,000 | $98,988 |
| 2020 | $2,912 | $129,595 | $42,000 | $87,595 |
| 2019 | $2,729 | $117,871 | $31,500 | $86,371 |
| 2018 | $2,014 | $92,209 | $29,050 | $63,159 |
| 2017 | $2,672 | $92,173 | $28,000 | $64,173 |
| 2016 | $1,886 | $85,500 | $21,000 | $64,500 |
| 2015 | $1,882 | $64,327 | $14,000 | $50,327 |
| 2014 | $1,827 | $61,189 | $14,000 | $47,189 |
Source: Public Records
Map
Nearby Homes
- 1581 Latigo Dr
- 1590 Mustang Dr
- 1424 Colt Dr
- 2031 Buckeye Reef St
- 2120 Thoroughbred Rd
- 1590 Sundown Dr
- 1916 Chickasaw Dr
- 2193 Red Alder St
- 1290 Dalene Ave
- 2181 Maple Shade St
- 2006 Darla St
- 2050 S Magic Way Unit 201
- 2050 S Magic Way Unit 203
- 2050 S Magic Way Unit 210
- 2050 S Magic Way Unit 176
- 2050 S Magic Way Unit 181
- 2050 S Magic Way Unit 66
- 2050 S Magic Way Unit 192
- 2050 S Magic Way Unit 26
- 2011 Darla St
- 1580 Colt Dr
- 1571 Bridle Dr
- 1561 Bridle Dr
- 1581 Bridle Dr
- 1571 Colt Dr
- 1581 Colt Dr
- 1561 Colt Dr
- 1590 Colt Dr
- 1912 Pinto Rd
- 479 Waterfall Cove Ct
- 479 Waterfall Cove Ct Unit 55
- 496 Blue Ridge Cove Ct Unit 56
- 1901 Roan Rd
- 1910 Pinto Rd
- 1551 Colt Dr
- 1570 Derby Dr
- 1570 Bridle Dr
- 1560 Derby Dr
- 1580 Bridle Dr
- 1560 Bridle Dr